Refer to the exhibits.
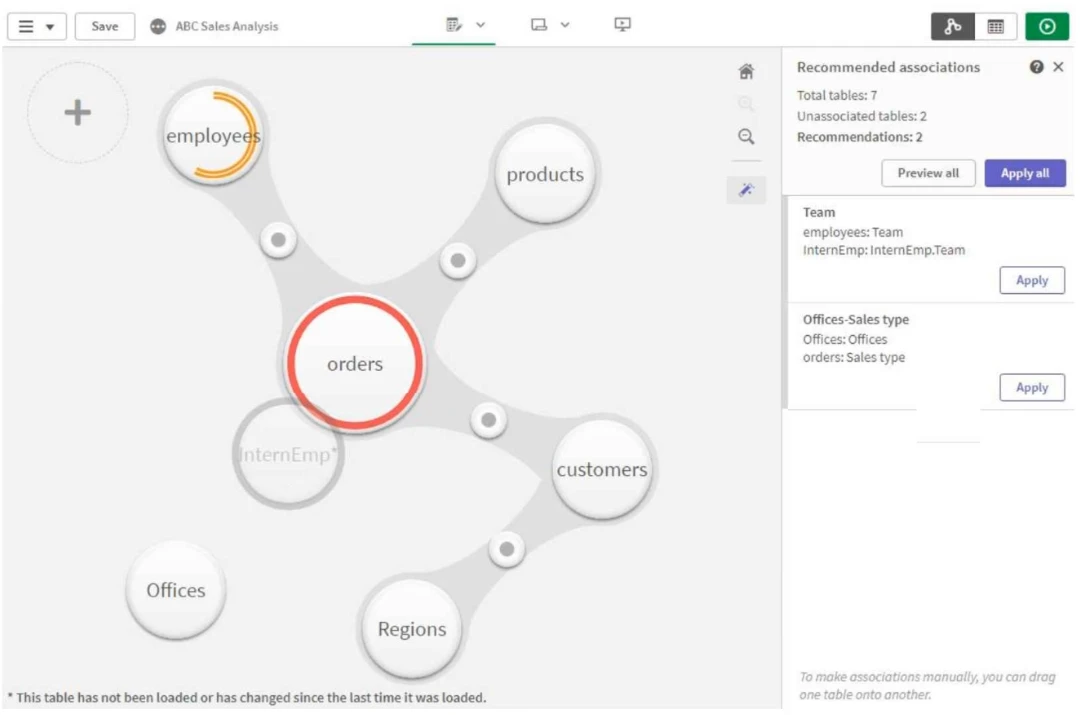
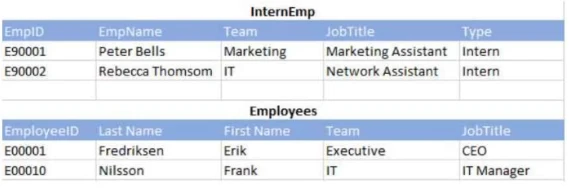
A business analyst must add a list of temporary employees (interns) to the current sales app. The app contains an existing employees table. When the business analyst profiles the data, the association view displays possible associations as shown.
Which action should the business analyst take in Data manager to meet the requirements?