Which procedure should the business analyst follow?

Refer to the exhibit.
An app is being developed at a university to monitor student exam attempts. Three core tables are loaded into the app for Students, Exams, and Attempts. Students can attempt the same exam multiple times.
Before building any visualizations, the business analyst needs to know:
• How many students are in the system
• What percentage of students have not yet attempted an exam
Which metadata should the analyst focus on to answer these questions?
Refer to the exhibit.
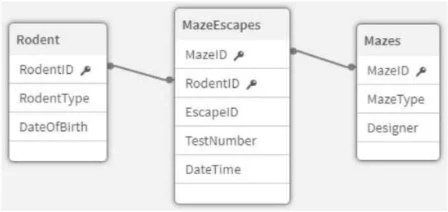
An app that will track experiments for rodents (e.g., rats and mice) that navigate mazes (labyrinths) is being developed. Individual rodents are catalogued in the Rodent table, while the Mazes table has metadata for the mazes. The MazeEscapes table holds a record of each attempt at a maze by a rodent. A business analyst needs to build a KPI that will allow users to see how many rodents have made at least one attempt at any maze.
How should the analyst construct the KPI?
Refer to the exhibit.
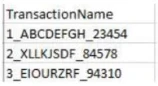
The users of a Qlik Sense app report slow performance. The app contains approximately 10 million rows of data. The business analyst notices the following KPI master measure definition:
Left( Trim( TransactionName), 1 ) * Right ( TransactionName, 5)
Which steps should the business analyst complete to improve app performance?
There is data for the following countries under the field SACOUNTRY -> France, Spain, United Kingdom and Germany. The application has been designed with Section Access to manage the data displayed.

What is the expected outcome of this Section Access table?