Analyzing Data with Microsoft Power BI

Here you have the best Microsoft DA-100 practice exam questions

  • You have 94 total questions to study from
  • Each page has 5 questions, making a total of 19 pages
  • You can navigate through the pages using the buttons at the bottom
  • This questions were last updated on December 13, 2024
Question 1 of 94

You have a custom connector that returns ID, From, To, Subject, Body, and Has Attachments for every email sent during the past year. More than 10 million records are returned.

You build a report analyzing the internal networks of employees based on whom they send emails to.

You need to prevent report recipients from reading the analyzed emails. The solution must minimize the model size.

What should you do?

    Correct Answer: B

    To prevent report recipients from reading the analyzed emails while also minimizing the model size, you should remove the Subject and Body columns during the import. This eliminates unnecessary data, directly reducing the model size and avoiding any unwanted visibility of email contents. Simply hiding columns or implementing row-level security would not reduce the model size, they only affect data visibility while keeping the underlying data in the model.

Question 2 of 94

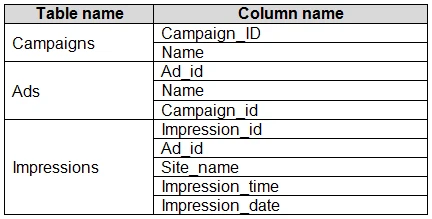
You have the tables shown in the following table.

The Impressions table contains approximately 30 million records per month.

You need to create an ad analytics system to meet the following requirements:

✑ Present ad impression counts for the day, campaign, and Site_name. The analytics for the last year are required.

✑ Minimize the data model size.

Which two actions should you perform? Each correct answer presents part of the solution.

NOTE: Each correct selection is worth one point.

    Correct Answer: A, B

    To meet the requirements of presenting ad impression counts for the day, campaign, and Site_name while minimizing the data model size, you should group the impressions by Ad_id, Site_name, and Impression_date and aggregate by using the CountRows function to reduce the size of the data upfront. Additionally, creating one-to-many relationships between the tables will ensure the data is properly related and can be analyzed across the different dimensions (campaigns, ads, and impressions). This combination will help achieve the required analytics with a minimized data model.

Question 3 of 94

Your company has training videos that are published to Microsoft Stream.

You need to surface the videos directly in a Microsoft Power BI dashboard.

Which type of tile should you add?

    Correct Answer: D

    To surface videos directly in a Microsoft Power BI dashboard from Microsoft Stream, a 'Web Content' tile should be used. This allows embedding of any web content, including videos, by using the embed code provided by Microsoft Stream. Power BI does not have a specific 'video' tile, and 'custom streaming data' is used for real-time data streams, not for embedding pre-recorded videos. The 'text box' option is not relevant for embedding videos.

Question 4 of 94

You open a query in Power Query Editor.

You need to identify the percentage of empty values in each column as quickly as possible.

Which Data Preview option should you select?

    Correct Answer: D

    Column quality: This option provides immediate visibility into the percentage of valid, error, and empty data values for each column in a table within the Power Query Editor. This functionality is especially useful for quickly identifying empty values, fulfilling the requirement specified in the question.

Question 5 of 94

You have a prospective customer list that contains 1,500 rows of data. The list contains the following fields:

✑ First name

✑ Last name

✑ Email address

✑ State/Region

✑ Phone number

You import the list into Power Query Editor.

You need to ensure that the list contains records for each State/Region to which you want to target a marketing campaign.

Which two actions should you perform? Each correct answer presents part of the solution.

NOTE: Each correct selection is worth one point.

    Correct Answer: C, E

    DE

    Data Profiling, Quality & Distribution in Power BI / Power Query features

    To enable these features, you need to go to the View tab ֳ  Data Preview Group ֳ  Check the following:

    ✑ Column quality

    ✑ Column profile

    ✑ Column distribution

    ✑ Column profile

    Turn on the Column Profiling feature.

    ✑ Column distribution

    Can use it to visually realize that your query is missing some data because of distinct and uniqueness counts.

    Reference:

    https://www.poweredsolutions.co/2019/08/13/data-profiling-quality-distribution-in-power-bi-power-query/ https://www.altentertraining.com/microsoft/power-bi/column-profiling-is-good/