Question 6 of 18

Answer

Suggested Answer

maximum calculated columns
Step 1: Click Manage Service Applications under Application Management.
Step 2: In the list on the Manage Service Applications page, select the desired Access service you want to configure.
Step 3: On the Access Services Settings page, under Maximum Calculated Columns Per Query, enter the value 32.
Question 7 of 18

Answer

Suggested Answer

Step 1: Select your My Profile drop-down menu at the upper right corner on the screen.
Exam 77-886: Question 7 - Image 2

Note: Note A team site created within SharePoint includes a My Site link in the My Profile drop-down menu of your user name found in the upper right of the screen.
Step 2: Click the Tags & Notes button.
Step 3: Click the Note Board tab.
Step 4: Enter text: leaving tomorrow.
Step 5: Click Post. Exam 77-886: Question 7 - Image 1
Question 8 of 18

Answer

Suggested Answer

Step 1: Click Site Pages -
Step 2: Open the Library ribbon and from the Settings group click Library Settings
Question 9 of 18

Exam 77-886: Question 9 - Image 1

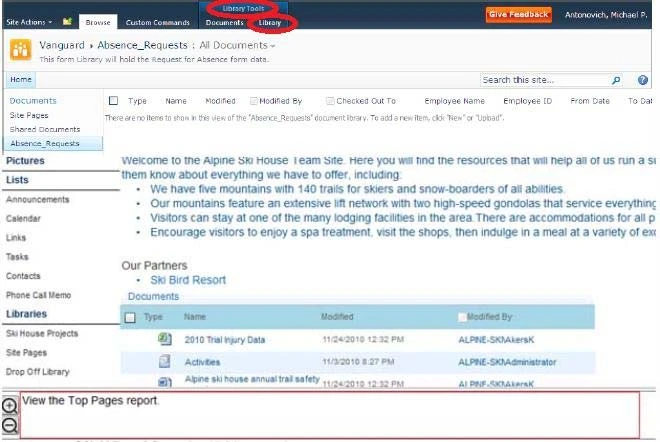
Top Pages report Usage/ Activity Reports on Usage and Activity can be generated by Site Collection Administrators and Site Administrators. A few examples of these reports are as follows:

  • Number of Page views
  • Number of Daily Unique Users
  • Top Pages web analytics
Answer

Suggested Answer

Step 1: Select Site Action->Central Administration
Exam 77-886: Question 9 - Image 2
Step 2: Under Monitoring Heading click View Web Analytis reports
Step 3: Click the Top Pages report. Answer:
Question 10 of 18

Answer

Suggested Answer

Step 1: Click Tasks -
Step 2: Locate the select the Groom Slopes task.
Step 3: Click the Edit Item button.
Step 4: Set the Predecessors field to: Inspect Ski Lifts.
Note: You use a Gantt chart in project management as a way to visually show the sequence of tasks in a project along a horizontal timeline.
Project Tasks List