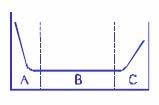
The failure rate model above is used to show a typical relationship of many parts between their failure rate and the time in service. The reliability function for period
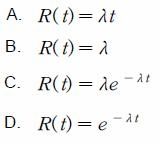
"B" is BEST represented by
The failure rate model above is used to show a typical relationship of many parts between their failure rate and the time in service. The reliability function for period
"B" is BEST represented by
The diagram represents the bathtub curve, a common model for the failure rate of products over time. Period B corresponds to the flat, middle section of the curve, indicating a constant failure rate, which is characteristic of the useful life phase. The reliability function for a constant failure rate is best represented by an exponential decay function: R(t) = e^(-λt), where λ is the constant failure rate. Thus, the correct answer is D.
Yes acceptable