Tableau Certified Data Analyst
Here you have the best Tableau TDA-C01 practice exam questions
- Preview the first 5 of 214 questions for free
- These questions were last updated on April 30, 2026
- This site is not affiliated with or endorsed by Tableau.
Here you have the best Tableau TDA-C01 practice exam questions
You are the owner of an alert.
You receive an email notification that the alert was suspended.
From where can you resume the suspended alert?
You have the following data source in Tableau Server.
You need to ensure that the data is updated every hour.
What should you select?
You have the following tiled dashboard that has one sheet.
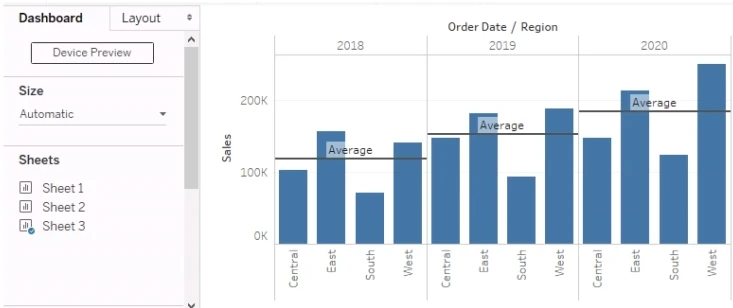
You want to replace the sheet with Sheet2.
What should you do?
You have the following primary data source that contains a dimension named Dorm_Code.
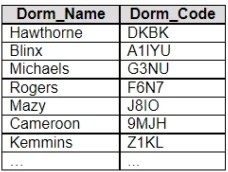
You receive the following secondary data source that contains updated dorm codes.
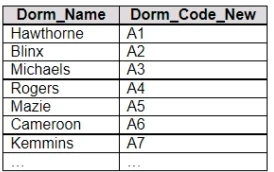
You need to bring the updated dorm codes into Tableau and use the codes in existing visualizations. The new dorm codes must use the existing field name of Dorm_Code.
What should you do?
You plan to create a visualization that has a dual axis chart. The dual axis chart will contain a shape chart and a line chart. Both charts will use the same measure named Population on the axis.
You need to configure the shapes to be much larger than the line.
What should you do?
Unlock the full Tableau TDA-C01 question bank
One-time payment · No subscription · No hidden fees
Standard
Quick preparation
30 days access
Premium
Guaranteed success
90 days access
Printable PDF download
NewSave every question as a PDF for offline study or printing.
100% Money-Back Guarantee
Don't pass? Full refund.
Based on 4,420+ reviews
Join certified professionals who passed their exams with Examice
Examice helped me pass my AWS certification on the first try! The questions were incredibly similar to the real exam. Comments helped me understand answers I was struggling with.
Great results in a short prep time. Passed on my first attempt.
I needed to pass an exam for work, and this website delivered. The quality for the price is outstanding, and the support is really good. I passed without issues.
Skeptical at first, but impressed. Every question included clear, detailed explanations.
The guarantee gave me confidence to invest in the premium package. Turns out I didn't need it. Passed comfortably. The explanations for each answer were incredibly detailed and helped me grasp security concepts that I'd been struggling with for months.
Used Examice for my PMP certification. The questions were well structured and covered all exam domains thoroughly.
After failing my first attempt with other study materials, I switched to Examice and passed confidently on my second attempt.
The premium package was worth it. 90 days of access gave me the flexibility to study when it worked for me, without feeling rushed.
Straightforward questions that matched the real exam perfectly. Studied for two weeks and passed with a great score.
Everything you need to know. Contact us for more.
Our Tableau TDA-C01 questions are based on real exam experiences and are continuously updated to match the current exam format. We maintain a +99% pass rate because our questions closely mirror what you'll see on the actual exam.
With our Premium package, you get a 100% money-back guarantee. If you don't pass your exam after studying with our materials, simply contact us with your exam results and we'll refund your purchase. Terms and conditions apply, read our full refund policy to learn more.
Our question bank is updated regularly based on feedback from recent exam takers. We typically review and update our content every week with reports about new questions or changes to the exam format.
Standard package access cannot be extended. However, Premium package gives you 90 days which is typically more than enough time to prepare thoroughly. If you need additional time, you can purchase a new package at any time.
This is a one-time payment with no recurring charges. Once you purchase, you get full access to all exam questions for the duration of your package (30 days for Standard, 90 days for Premium). No hidden fees or automatic renewals.
All 214questions · Detailed explanations · Printable PDF · 90 days access
one-time payment