Which widget property allows a consultant to restrict the view to a domain bounded by the values entered?
The widget property that allows a consultant to restrict the view to a domain bounded by the values entered is 'Add Custom Domain.' This feature enables users to set specific boundaries or limits within which data can be viewed, ensuring that only data within a certain range of values is displayed.
A Tableau CRM consultant is asked to add a new SalesTax field to a Product Sales dataset. The formula to calculate SalesTax is (SubTotal"CountyTax).
Which node should the consultant use in a Dataflow to calculate and insert SalesTax to the dataset?
In a Tableau CRM dataflow, the 'computeExpression' node is used to compute new fields based on existing data. Since the task is to calculate a new 'SalesTax' field using a formula based on other fields within the dataset, 'computeExpression' is the appropriate node to use. Nodes like 'augment', 'computeRelative', and 'append' serve different purposes such as adding columns from another dataset, performing relative calculations, and adding rows, respectively. For creating new calculated fields, 'computeExpression' is the correct choice.

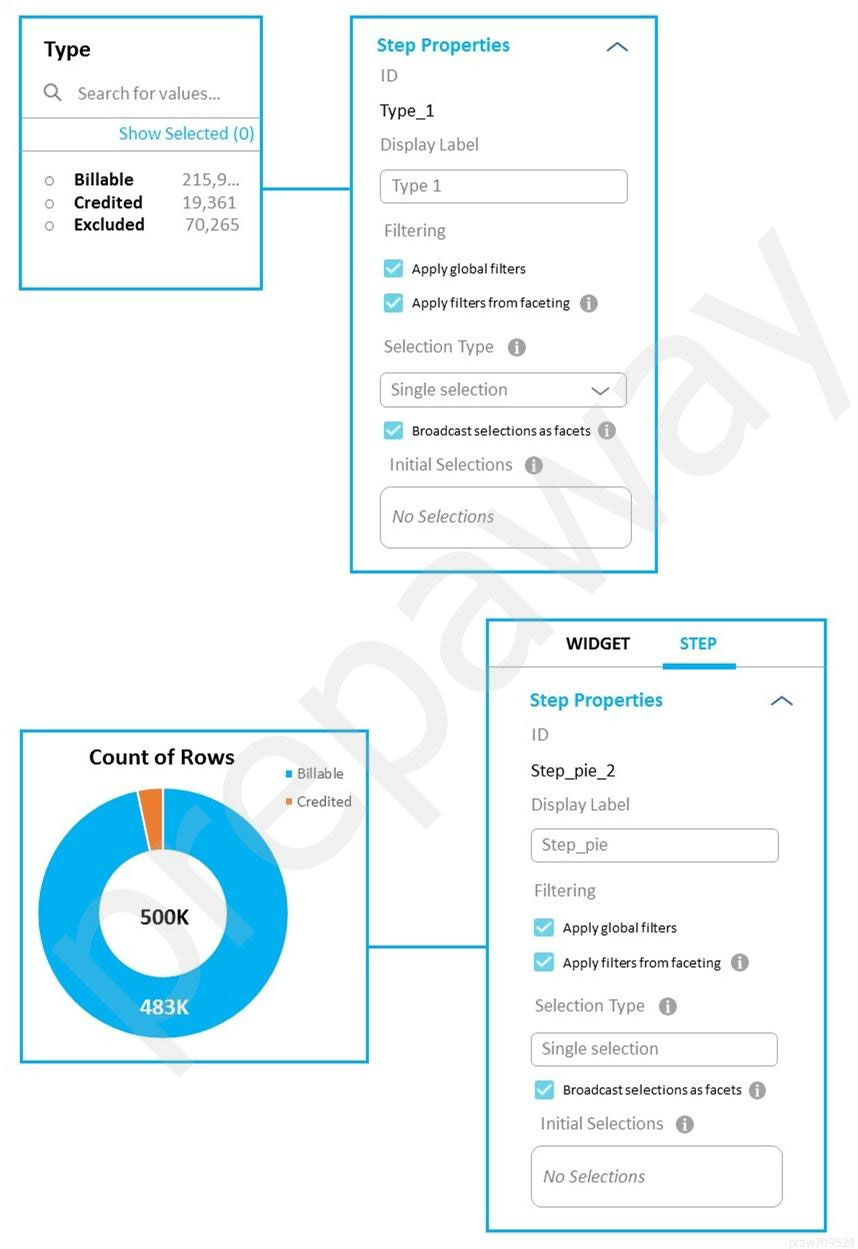
Universal Containers reports that any selection in the List widget is not affecting the Pie chart in one of their Tableau CRM dashboards. The query options associated with the List widget and Pie chart are shown in the graphic.
Given that the queries are using different datasets, which two changes can a Tableau CRM Consultant make to solve this issue? (Choose two.)
To address the issue of the List widget selection not affecting the Pie chart, the Tableau CRM Consultant should use selection binding in the filters section of both queries (Type_1 and Step_pie_2). Selection binding ensures that the selected values in the List widget are applied as filters to the datasets used by both the List widget and the Pie chart, thereby synchronizing the two components. By applying selection binding in the filters section of both queries, we can make sure that the interaction between the List widget and the Pie chart is functional.
Which three things can be done with the Tableau CRM Dashboard Inspector? (Choose three.)
BDE
Reference:
https://help.salesforce.com/s/articleView?id=sf.bi_dashboard_build_flex.htm&type=5


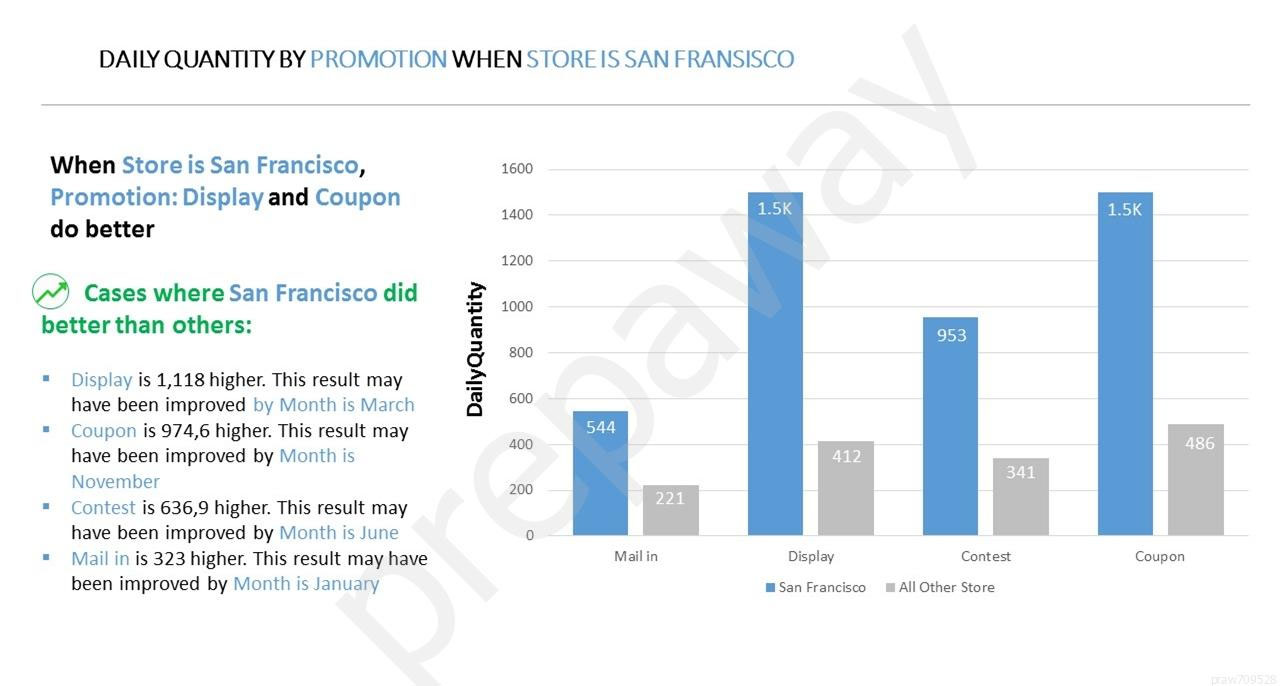
A customer is reviewing a story that is set to maximize the daily sales quantity of consumer products in stores, and the customer sees this chart related to promotional activities and to San Francisco specifically.
What conclusion can be drawn from this insight?
The conclusion that can be drawn is that of all promotion types in San Francisco, sales were the highest using Display promotion. The data shows that Display and Coupon promotions both have the highest daily quantities at 1.5k, indicating their effectiveness in San Francisco. While Coupon performs equally well, the significant sales data for the Display promotion supports the conclusion.