Analyzing and Visualizing Data with Microsoft Excel

Here you have the best Microsoft 70-779 practice exam questions

  • You have 98 total questions to study from
  • Each page has 5 questions, making a total of 20 pages
  • You can navigate through the pages using the buttons at the bottom
  • This questions were last updated on November 15, 2024
Question 1 of 98

Note: This question is part of a series of questions that present the same scenario. Each question in the series contains a unique solution that might meet the stated goals. Some question sets might have more than one correct solution, while others might not have a correct solution.

After you answer a question in this section, you will NOT be able to return to it. As a result, these questions will not appear in the review screen.

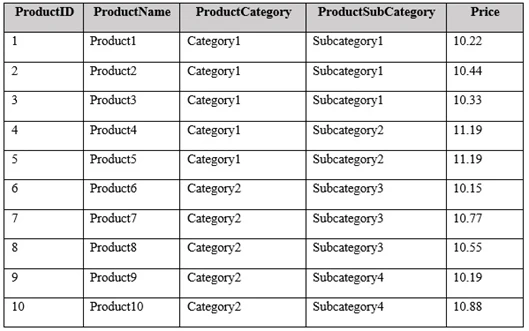
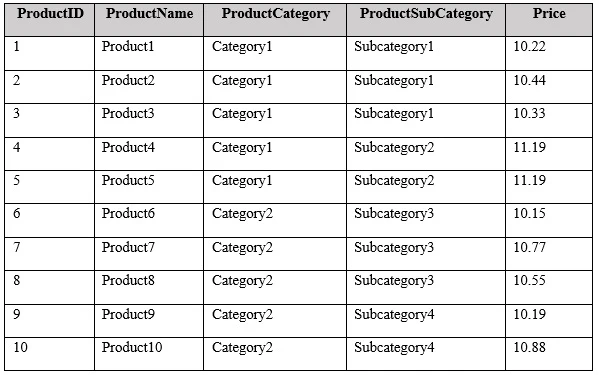
You have an Excel workbook that contains a table named Table1. A sample of the data in Table1 is shown in the following table.

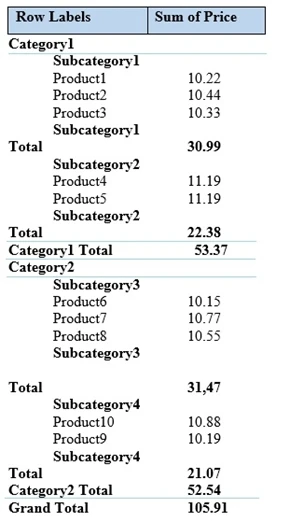
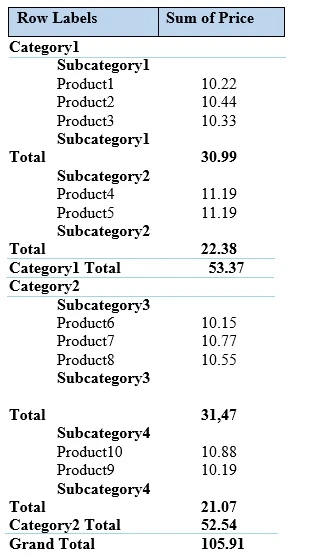
You need to create a PivotTable in PowerPivot as shown in the exhibit. (Click the Exhibit button.)

Solution: You create a measure named products the uses the DataTable DAX function. You add a PivotTable. You drag Products to the Rows field. You drag

Price to the Values field.

Does this meet the goal?

    Correct Answer: B

    To create a PivotTable as shown in the exhibit, you need to organize data into hierarchical levels such as ProductCategory, ProductSubCategory, and ProductName in the Rows field, and aggregate the Price in the Values field. Simply creating a measure and dragging Products to the Rows field and Price to the Values field would not achieve the desired structure and hierarchy in the PivotTable. Therefore, the given solution does not meet the goal.

Question 2 of 98

Note: This question is part of a series of questions that present the same scenario. Each question in the series contains a unique solution that might meet the stated goals. Some question sets might have more than one correct solution, while others might not have a correct solution.

After you answer a question in this section, you will NOT be able to return to it. As a result, these questions will not appear in the review screen.

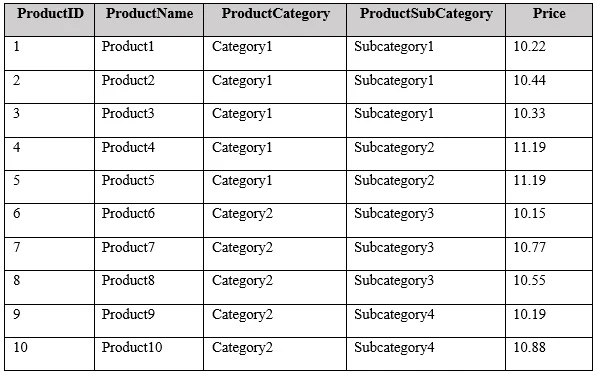
You have an Excel workbook that contains a table named Table1. A sample of the data in Table1 is shown in the following table.

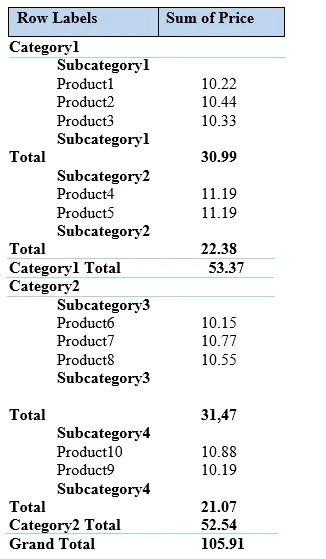
You need to create a PivotTable in PowerPivot as shown in the exhibit. (Click the Exhibit button.)

Solution: You create a hierarchy named Products that contains ProductCategory, ProductSubCategory, and ProductName. You add a PivotTable. You drag

Products to the Rows field. You drag Price to the Values field.

Does this meet the goal?

    Correct Answer: B

    Creating a hierarchy named Products that contains ProductCategory, ProductSubCategory, and ProductName, then adding a PivotTable with Products in the Rows field and Price in the Values field partially meets the goal. However, the problem is that, by default, subtotals in a compact layout are shown at the top of the groups. To achieve the layout in the exhibit, you would need to customize the PivotTable settings to show all subtotals at the bottom of the group. Therefore, additional steps are required beyond those described in the solution, so the answer is no.

Question 3 of 98

Note: This question is part of a series of questions that present the same scenario. Each question in the series contains a unique solution that might meet the stated goals. Some question sets might have more than one correct solution, while others might not have a correct solution.

After you answer a question in this section, you will NOT be able to return to it. As a result, these questions will not appear in the review screen.

You have an Excel workbook that contains a table named Table1. A sample of the data in Table1 is shown in the following table.

You need to create a PivotTable in PowerPivot as shown in the exhibit. (Click the Exhibit button.)

Solution: You add a PivotTable. You drag ProductCategory, ProductSubCategory, and ProductName to the Rows field. You drag Price to the Values field.

Does this meet the goal?

    Correct Answer: A

    To create the pivot table as shown, you need to add a PivotTable, drag ProductCategory, ProductSubCategory, and ProductName to the Rows field, and drag Price to the Values field. This arrangement will categorize the data correctly, showing the desired hierarchy and subtotals. The layout and positioning of totals can be adjusted in the PivotTable settings under the Design tab, setting the subtotals to appear at the bottom. Therefore, this solution meets the goal.

Question 4 of 98

Note: This question is part of a series of questions that present the same scenario. Each question in the series contains a unique solution that might meet the stated goals. Some question sets might have more than one correct solution, while others might not have a correct solution.

After you answer a question in this section, you will NOT be able to return to it. As a result, these questions will not appear in the review screen.

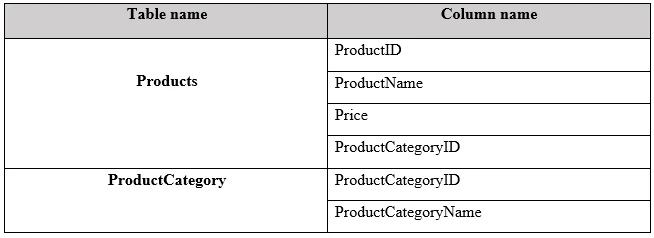
You have a Power Pivot model that contains the following tables.

There is a relationship between Products and ProductCategory.

You need to create a hierarchy in Products that contains ProductCategoryName and ProductName.

Solution: You create a measure that uses the USERELATIONSHIP DAX function.

Does this meet the goal?

    Correct Answer: B

    The goal is to create a hierarchy that includes columns from the Products and ProductCategory tables. A measure, which is an aggregation, is not relevant for creating hierarchies, as hierarchies are typically created using columns. The USERELATIONSHIP function is used to activate an inactive relationship, not needed here since the relationship already exists between these tables. Therefore, the given solution does not meet the goal.

Question 5 of 98

Note: This question is part of a series of questions that present the same scenario. Each question in the series contains a unique solution that might meet the stated goals. Some question sets might have more than one correct solution, while others might not have a correct solution.

After you answer a question in this section, you will NOT be able to return to it. As a result, these questions will not appear in the review screen.

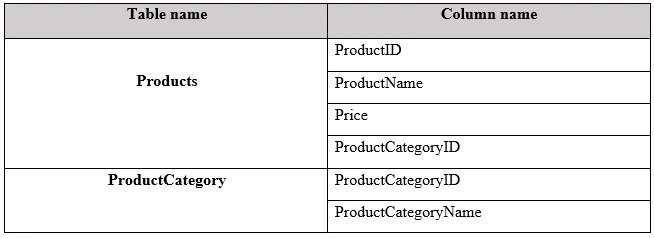
You have a Power Pivot model that contains the following tables.

There is a relationship between Products and ProductCategory.

You need to create a hierarchy in Products that contains ProductCategoryName and ProductName.

Solution: You create a calculated column that uses the RELATED DAX function

Does this meet the goal?

    Correct Answer: B

    Creating a hierarchy in Power Pivot involves organizing columns into a parent-child structure, allowing for drill-down and aggregation. While the RELATED function in DAX is useful for fetching related values from another table, it simply adds a calculated column to the table. This does not inherently create a hierarchy. To create a hierarchy, you would need to manually create a hierarchy in the Power Pivot model pane by dragging and dropping fields into a hierarchy structure. Therefore, using the RELATED function alone does not meet the goal of creating a hierarchy.