Which of the following searches would create a graph similar to the one below?
Which of the following searches would create a graph similar to the one below?
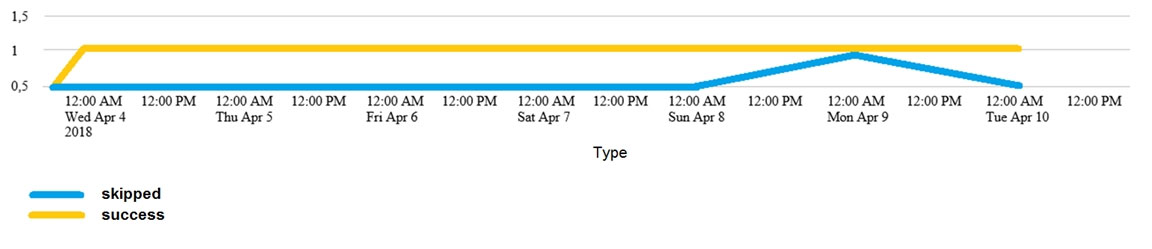
The search that would generate a graph similar to the one shown uses the timechart command to plot the counts of events by their status over time. The 'timechart count by status' command creates a line chart with the x-axis representing the time and the y-axis representing the count of events, which matches the provided graph. The maxspan=1d argument in the transaction command does not impact the ability of timechart to generate the correct graph, as timechart focuses on the time and status fields for plotting, not on the spanning of transactions. Therefore, option C is the correct choice.
Answer is D. The argument maxspan=1d will join events to one transaction by status per day. You would see the curve lines on graph if answer C is right, cause graph values are shown with span=12h
The graphs values are well shown with 24h span, it's just the x axis showing the 12h intervals but there is no point in between. C.
Correct, but your reasoning is abit off, maxspan will set the maximum point between the earliest and latest transaction, so 1D would be the maximum limit between the first/last, which is obviously not true in the graph.
C is the right answer.
Tested . C appears to be correct
I would go for answer D: (fields sourcetype, status are not equal to skipped and succes)
While I was on playing around with the Splunk training data (sourcetype=access_combined_wcookie), seems C produces the same type linechart graph (assuming the status field has only 2 values in the events skipped and success)..
could you pls confirm the final answer friends?
https://docs.splunk.com/Documentation/Splunk/9.0.2/SearchReference/Transaction maxspan Syntax: maxspan=<int>[s | m | h | d] Description: Specifies the maximum length of time in seconds, minutes, hours, or days that the events can span. The events in the transaction must span less than integer specified for maxspan. Events that exceed the maxspan limit are treated as part of a separate transaction. If the value is negative, the maxspan constraint is disabled and there is no limit. Default: -1 (no limit)
answer is D?
C works, tested with different sourcetype that has the same status field with skipped and success index=_internal sourcetype=scheduler | fields sourcetype, status | transaction status maxspan=1d | timechart count by status
Timechart must have _time on the x-axis. this is definitely not tirmechart
@Hurshbabe what is the x-axis in your opinion? the vertical or horizontal line? Because i see time on the x-axis.
what is the correct answ C or D?
C is the correct answer
I tested it and C gives similar result. what I tried : index=web sourcetype=access_combined | fields sourcetype, status | transaction status maxspan=1d | timechart count by status