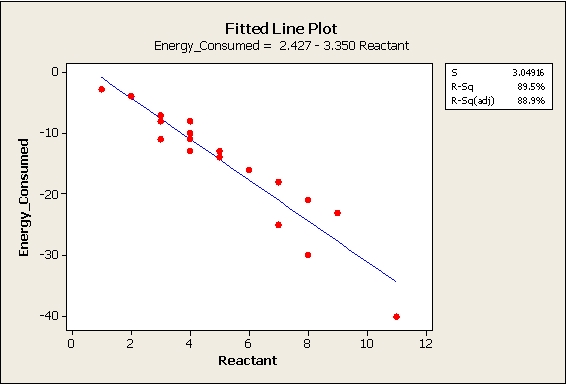
Which statement(s) are true about the Fitted Line Plot shown here? (Note: There are 2 correct answers).

Which statement(s) are true about the Fitted Line Plot shown here? (Note: There are 2 correct answers).

In the Fitted Line Plot, the equation of the line is given as Energy_Consumed = 2.427 - 3.350 Reactant. To determine if the predicted output Y is close to -18 when the Reactant level is set to 6, we substitute 6 for Reactant in the equation: Energy_Consumed = 2.427 - 3.350(6) = 2.427 - 20.1 ≈ -17.673, which is close to -18, making statement C correct. Additionally, the R-Sq value is 89.5%, indicating that over 85% of the variation of the Energy Consumed is explained by the Reactant via this Linear Regression, making statement D correct.
C. The predicted output Y is close to -18 when the Reactant level is set to 6. D. Over 85 % of the variation of the Energy Consumed is explained by the Reactant via this Linear Regression.