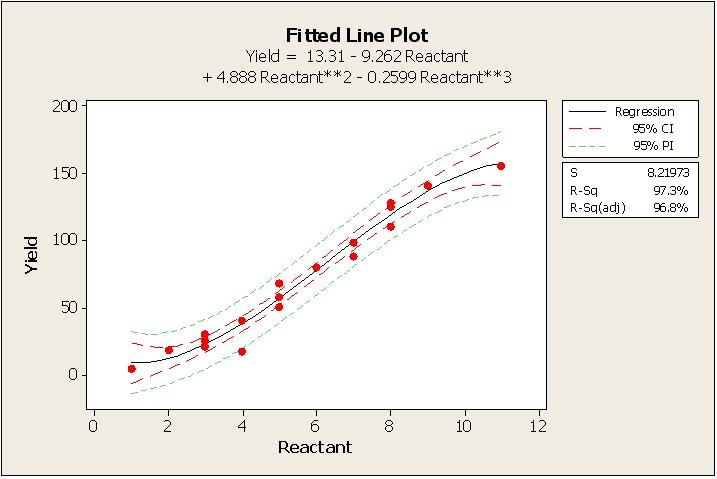
Which statement is NOT correct about the Fitted Line Plot shown here?

Which statement is NOT correct about the Fitted Line Plot shown here?

Option B is incorrect. From the fitted line plot, if the reactant is 6 units, the yield can be estimated from the regression equation and the confidence interval/prediction interval. The regression line indicates a yield lower than 100 units when the reactant is 6 units. Therefore, claiming a minimum yield of 100 units with 95% confidence is incorrect.
Correct answer is B?
B is correct
Correct answer should be B. If the reactant was 6 units, at 95% the expected value is in the middle of 50 and 100, and not a minimum value of 100.
I agree on B. It’s not D