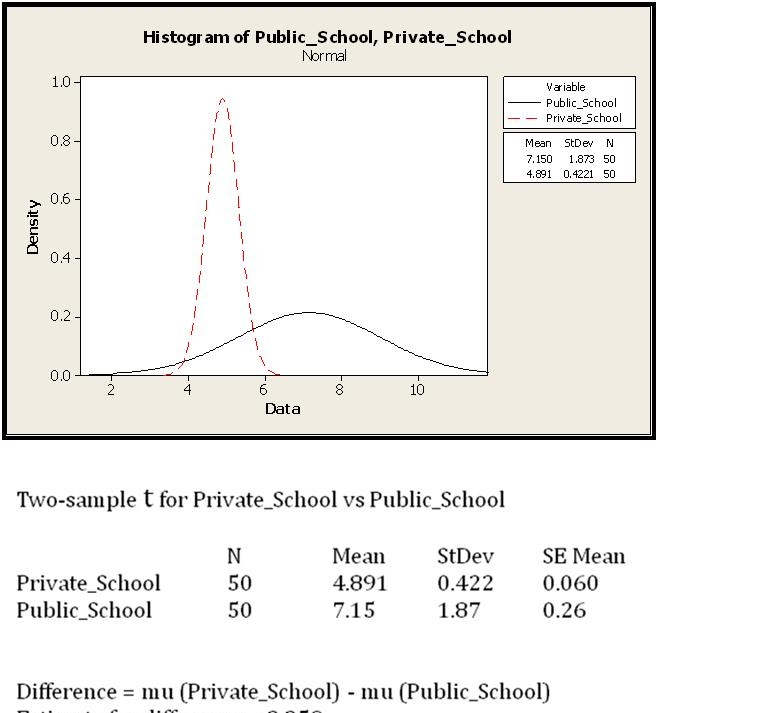
The class score distribution of schools in a metropolitan area is shown here along with an analysis output. Comment on the statistical significance between the
Means of the two distributions. Select the most appropriate statement.

The class score distribution of schools in a metropolitan area is shown here along with an analysis output. Comment on the statistical significance between the
Means of the two distributions. Select the most appropriate statement.

The analysis output shows a t-test for the means of the two distributions. Given the means and the standard deviations of the two groups (Private_School: mean = 4.891, Public_School: mean = 7.15), and considering the differences in their standard errors, the statistical analysis indicates that the means are statistically different. This conclusion is not purely based on visual comparison but on the results of the t-test and the provided summary statistics.
A is correct. Just memorize the answer.