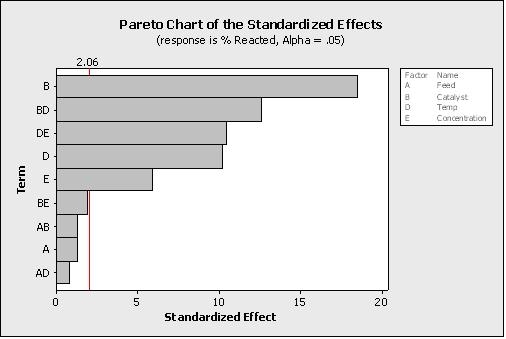
Which statement(s) are correct about the Pareto Chart shown here for the DOE analysis? (Note: There are 2 correct answers).

Which statement(s) are correct about the Pareto Chart shown here for the DOE analysis? (Note: There are 2 correct answers).

The Pareto Chart of the Standardized Effects is used to identify and prioritize the factors that have significant effects in a Design of Experiments (DOE) analysis. From the chart, we can determine that the effects of B, BD, DE, D, and E are significant as their bars cross the vertical line indicating the threshold for significance (standardized effect greater than 2.06, which relates to an alpha risk of 0.05). Therefore, the correct statements are that it is unknown from this graph how many factors were in the experimental design, and the effects to keep in the mathematical model are E, D, DE, BD, and B with an alpha risk equal to 0.05.
I am confused!