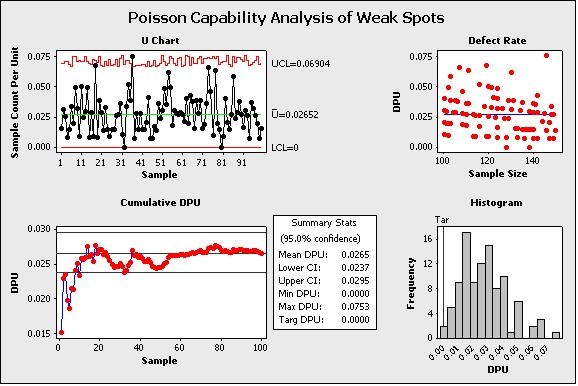
Which statements are correct about the advanced Capability Analysis shown here?

(Note: There are 3 correct answers).
Which statements are correct about the advanced Capability Analysis shown here?

(Note: There are 3 correct answers).
This is a Poisson Capability Analysis, as indicated at the top of the chart. The average Defects Per Unit (DPU) with 95% confidence is between 0.024 and 0.0295, as shown in the Summary Stats box on the chart. The DPU does not seem to vary depending on sample size, demonstrated by the scatter plot in the Defect Rate chart, which does not show a consistent pattern of variation with sample size. The maximum DPU is actually listed as 0.053 (refer to the Summary Stats box), so option E is incorrect.
what about the response A?
BCE is correct.
Easy way to remember the answer is to just memorize the incorrect answers.