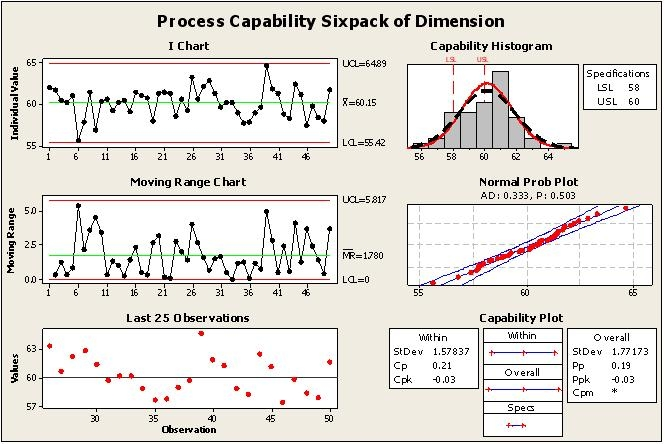
After reviewing the Capability Analysis shown here select the statement(s) that are untrue.

After reviewing the Capability Analysis shown here select the statement(s) that are untrue.

The process is properly assumed to be a Normal process is untrue. The confusion arises because the process performance or control is different from the distribution being normal. In the Normal Prob Plot, the P-value for the Anderson-Darling test is greater than 0.05, indicating that the distribution of the data is normal, but it doesn’t imply the process itself is properly assumed to be normal. Additionally, the majority of dimensional values are within tolerance limits, as evidenced by the histogram and individual charts showing most data points falling between the LSL and USL, making the statement that majority of the dimensional values are outside of tolerance untrue as well.
according to me the answer is D since the chart is I-MR so individual not sub groups
The confusion is between normal process and normal distribution. When the P-value of the AD test is greater than 0.05 then we say the distribution is normal not process is normal. Therefore answer A is the only untrue option.
P-value is 0.5 but the answer is A? The correct answer should the process is out of control.
I think is referring if the process in general is a normal process.
I think the answer A is correct too as it is untrue
I think that A & D is untrue
A. The process is properly assumed to be a Normal process