Select all the statements that are true after reviewing the Capability Analysis shown here. (Note: There are 4 correct answers).
Select all the statements that are true after reviewing the Capability Analysis shown here. (Note: There are 4 correct answers).
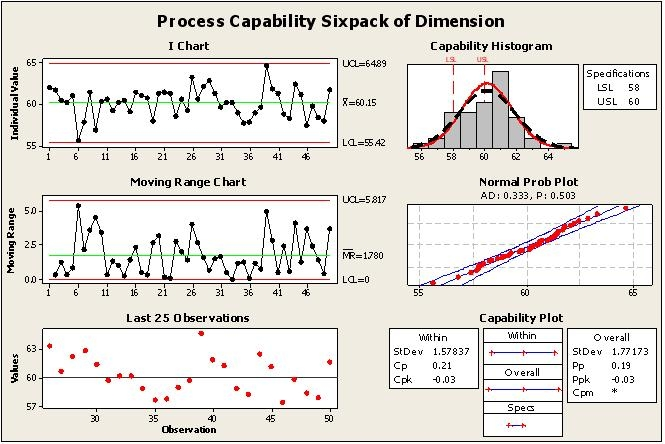
The process is out of control as evidenced by the I Chart where several points exceed control limits. The process can be assumed to be normal based on the Normal Probability Plot which aligns well with the fitted line. The mean of the process moving range is indeed 1.78 as indicated on the Moving Range Chart. This Capability Analysis seems not to use subgroups as shown in the I Chart which plots individual values rather than subgroup averages.
This is a wrong answer; correct one is ACDE and not BCDE; do you agree?
I do agree
I also agree - ACDE
can you plot subgroups on I chart (Individual chart)? I think D is wrong
B. The process is properly assumed to be a Normal process. C. The Mean of the process moving range is 1.78. D. This Capability Analysis used subgroups. E. Majority of the dimensional values are outside of the tolerance than within.
This question is the same question as question 21, but with different answers.