A00-240 Exam QuestionsBrowse all questions from this exam

A00-240 Exam - Question 15


A marketing analyst assessed the effect of web page design (A, B, or C) on customers' intent to purchase an expensive product. The focus group was divided randomly into three sub-groups, each of which was asked to view one of the web pages and then give their intent to purchase on a scale from 0 to 100. The analyst also asked the customers to give their income, which was coded as: I (lowest), II (medium), or III (highest). After analyzing the data, the analyst claimed that there was significant interaction and the webpage design mainly influenced high income people.

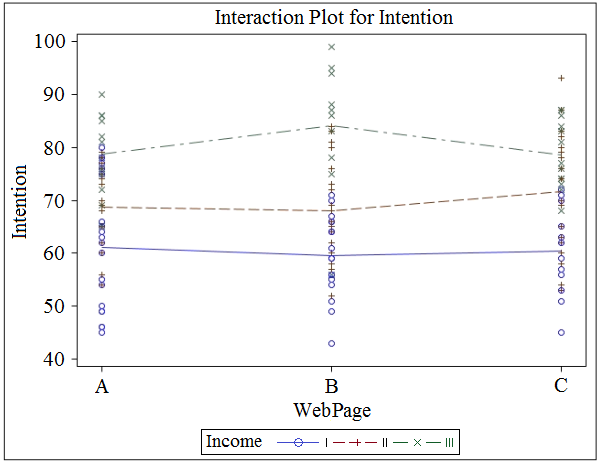
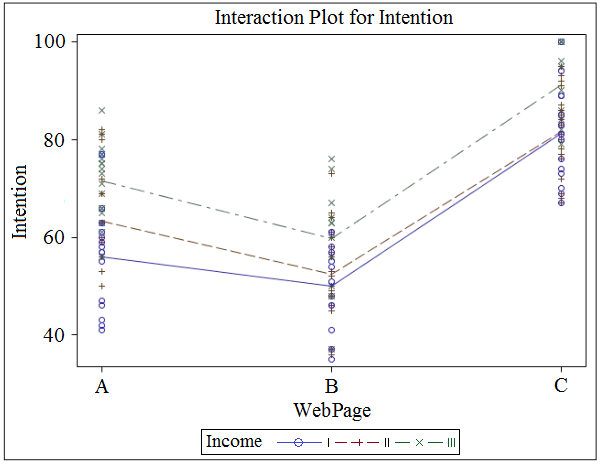
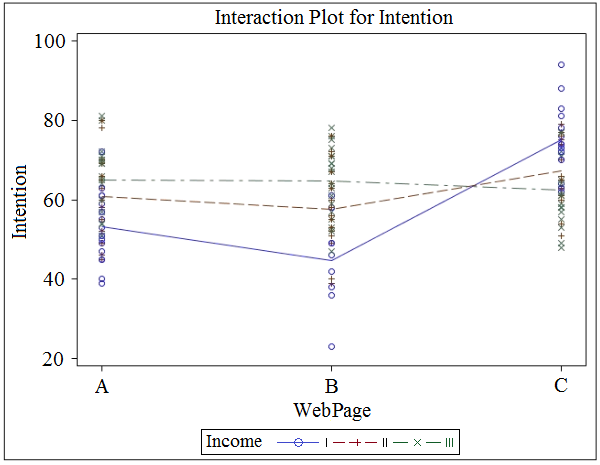
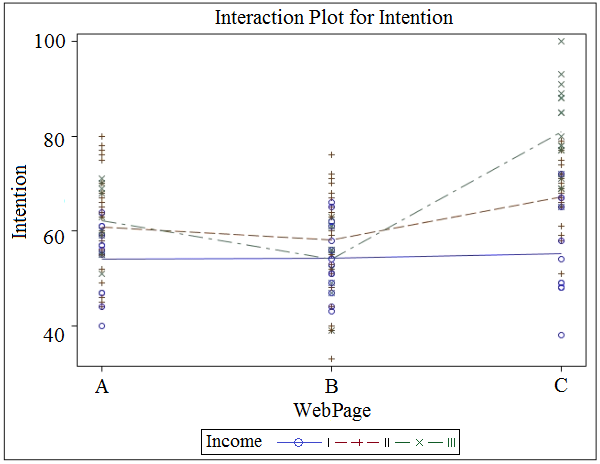
Which graph supports the analyst's conclusion?

A.
B.
C.
D.
Show Answer
Correct Answer:

The correct graph should show a significant interaction between web page design and income level, specifically demonstrating that high income people (III) have different purchasing intentions based on the web page design. In Graph A, the lines representing different income levels are relatively flat and parallel, indicating little to no interaction between web page design and income. Graph D shows a noticeable increase in intention for high income people (III) with web page design C compared to designs A and B, which aligns with the analyst's claim that web page design mainly influenced high income people. Hence, the correct answer is Graph D.

Discussion

2 comments
Sign in to comment
PerkDizzzle
Oct 25, 2020

I don't think the answer is right. I would lean more D or C.

dodoeum
Oct 22, 2020

Could you explain why please