Refer to the following exhibit:
What is a correct interpretation of this graph?
Refer to the following exhibit:
What is a correct interpretation of this graph?
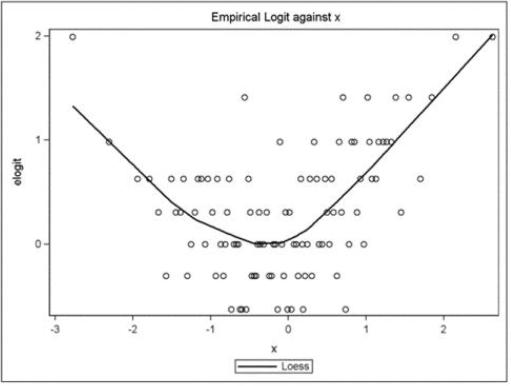
The graph displays the empirical logit, which relates to the log-odds of a binary response variable, plotted against a continuous predictor variable (x). The graph shows a quadratic curve fit through these points, indicating that the relationship between the continuous predictor (x) and the log-odds of the binary response is quadratic.
What could be done to "fix" such a quadratic association?
You don't necessarily need to know how to "fix" a quadratic association. It's descriptive, you just need to know what story it's telling.