PL-300 Exam QuestionsBrowse all questions from this exam

PL-300 Exam - Question 119


DRAG DROP -

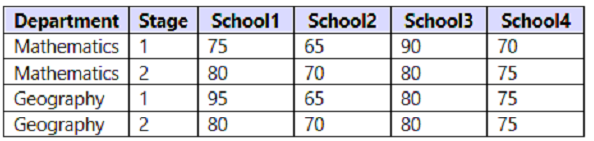
You have a Microsoft Excel spreadsheet that contains the data shown in the following table.

You plan to build a data model for a Power BI report.

You need to prepare the data so that it is available to the model in the format shown in the following table.

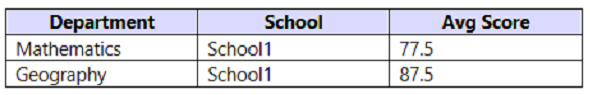
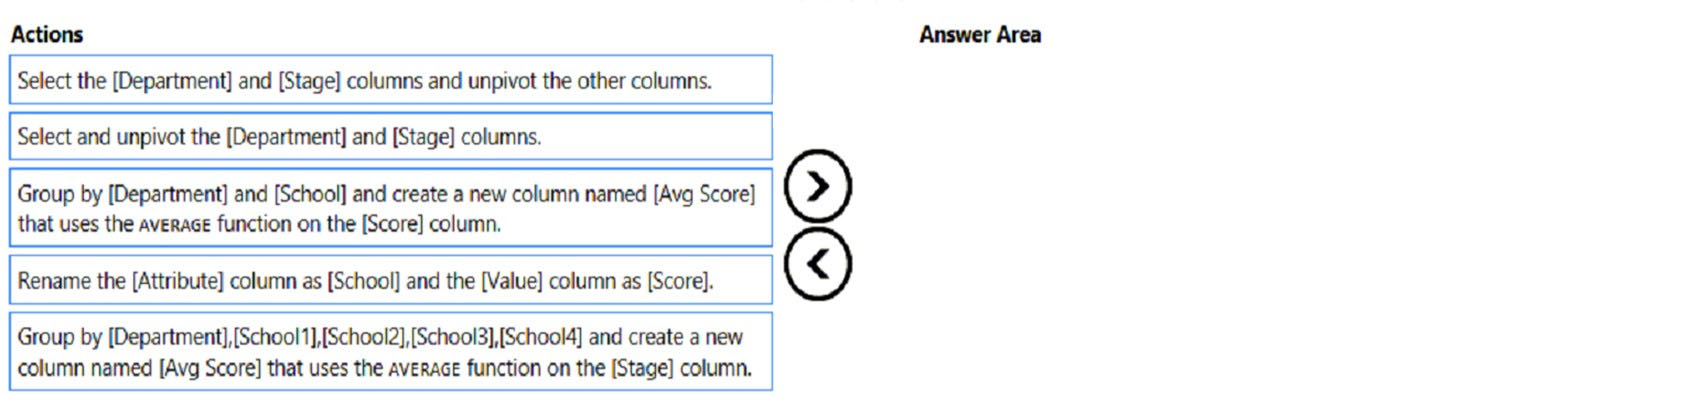
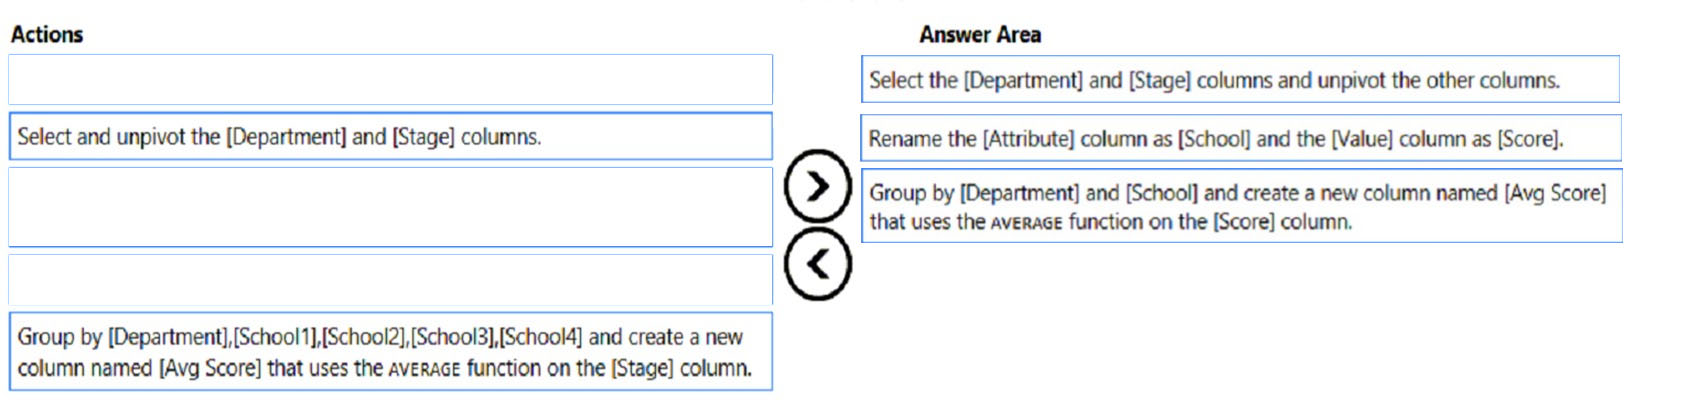
Which three actions should you perform in sequence in Power Query Editor? To answer, move the appropriate actions from the list of actions to the answer area and arrange them in the correct order.

Select and Place:

Show Answer
Correct Answer:

Step 1: Select the [Department] and [Stage] columns and unpivot the other columns.

We unpivot the School1, School2, School3, and the School4 columns.

You might want to unpivot data, sometimes called flattening the data, to put it in a matrix format so that all similar values are in one column.

Example:

When you unpivot, you unpack the attribute-value pairs that represent an intersection point of the new columns and re-orient them into flattened columns:

* Values (in blue on the left) are unpivoted into a new column (in blue on the right).

* Attributes (in green on the left) are unpivoted into a new column (in green on the right) and duplicates are correspondingly mapped to the new Values column.

Step 2: Rename the [Attribute] column as [School] and the [Value] column as [Score[,

Step 3: Group by [Department] and [School] and..

Reference:

https://support.microsoft.com/en-us/office/unpivot-columns-power-query-0f7bad4b-9ea1-49c1-9d95-f588221c7098

Discussion

17 comments
Sign in to comment
olajor
Sep 12, 2022

answer is correct

Churato
Oct 27, 2022

1) Select the [Department] and [Stage] aand Unpivot the other columns. 2) Rename the [Attribute] column as [School] and the [Value] column as [Score]. 3) Group by [Department] and [School] and create a new column named [Avg Score] that uses the average function on the [Score] column Tested here, and it's correct!

itenginerd
Sep 22, 2023

This was on my exam today

Usm_9
Mar 6, 2024

WAS ON THE EXAM 02 03 2024

RazaTheLegend
Apr 12, 2023

1) Select the [Department] and [Stage] aand Unpivot the other columns. 2) Rename the [Attribute] column as [School] and the [Value] column as [Score]. 3) Group by [Department] and [School] and create a new column named [Avg Score] that uses the average function on the [Score] column

ColinN
Aug 11, 2023

Correct answer.

rgabage
Aug 29, 2023

answer is correct

MS240396
Dec 26, 2023

Answer is correct..!

08b2ddd
Jan 2, 2024

CORRECT

ewelaela
Jan 15, 2023

Answer is correct

Shalaleh
May 3, 2023

1-4-3 order is correct.

SIH007
Jun 6, 2023

I don't understand why you have to create an average column. When you group you can set the number field to average.

Igetmyrole
Sep 6, 2023

Action 1: Select the [department] and [stage] columns and unpivot the other columns. Action 2: select and unpivot the [department] and [stage] columns. Action 3: Group by [department] and [school] and create a new column named [Avg Score] that uses the average function on the [score] column. Action 1: Will transform the data into a long format, making it easier to work with. Action 2: to provide meaningful column name. Action 3: will calculate the average score for each combination of department and school.

ElieG
Dec 16, 2023

When tested it doesn't give the same outcome as asked for, instead it give the mathematics with the correspondent schools then the geography. Can anyone tell anything about this?

DANIEL
Feb 22, 2024

answer is correct

ElieG
Apr 25, 2024

yes the answer steps work well, but they do not give the same result and even the result given for averages are fault as you can see for example the average of Mathematics score of school1 should be equal to (75+95)/2 which is 85 and not 77.5

agelee
Jul 19, 2024

Who would create Avg Score in PowerQuery instead of measure in PowerBI. So stupid.