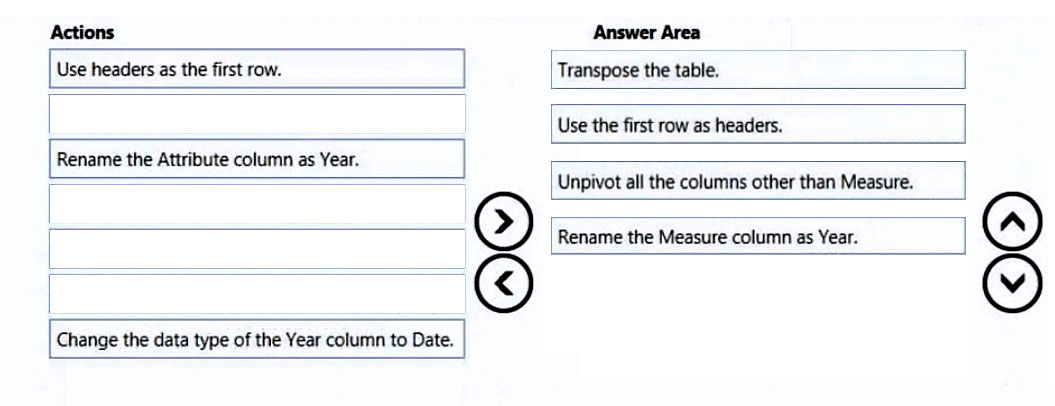
PL-300 Exam QuestionsBrowse all questions from this exam

PL-300 Exam - Question 51


DRAG DROP -

You are preparing a financial report in Power BI.

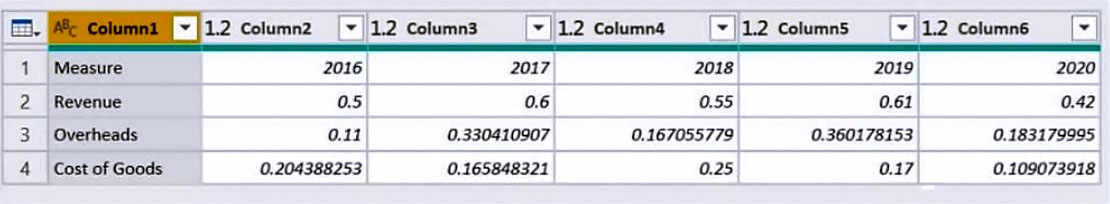
You connect to the data stored in a Microsoft Excel spreadsheet by using Power Query Editor as shown in the following exhibit.

You need to prepare the data to support the following:

✑ Visualizations that include all measures in the data over time

✑ Year-over-year calculations for all the measures

Which four actions should you perform in sequence? To answer, move the appropriate actions from the list of actions to the answer area and arrange them in the correct order.

Select and Place:

Show Answer
Correct Answer:

Reference:

https://docs.microsoft.com/en-us/power-query/unpivot-column

Discussion

17 comments
Sign in to comment
ThariCD
Sep 12, 2022

Answer is wrong, the table shouldn't be transposed, the order should be: 1. Use first row as header 2. Unpivot all columns other than "Measure" 3. Rename "Attribute" to "Year" 4. Change data type of "Year" to date (Date > Year)

AzureJobsTillRetire
Dec 21, 2022

Hi guys, I am wondering how you can do the second step - Unpivot all columns other than "Measure"? There is no column called "Measure" unless you transpose or unpivot it. This is a much more serious problem than the problem with the last step in the transpose solution - being the failure of change data type of "Year" to date.

AzureJobsTillRetire
Dec 21, 2022

Please disregard. long hours studying and I had brain frozen. My apologies.

Taras_Navakhatska
Feb 15, 2023

Why shouldn't? The titles should be on the top.

semauni
Apr 25, 2023

Transpose swaps rows and columns, which is not at all what you want. Source: https://learn.microsoft.com/en-us/power-query/transpose-table

semauni
Apr 25, 2023

I stand corrected, you want a year-to-year calculation for all the measures. That means that you need to keep the measures and the years intact. I think both is possible

prikha16
Jun 30, 2023

If we need to have visuals that show all measures over time, it would be better to have the measures in separate columns

RedRoss
Mar 14, 2024

Explained the whole question here: https://www.youtube.com/watch?v=0sci44xnto0

Chaka_Mahlo
Mar 25, 2024

YES. Transpose Use the first rows as headers Rename the measure as year Change the data type of the year column

Mo2011
May 13, 2024

Thank you so much

Kaarthi_2788
May 5, 2024

in this method we can plot the graph but we cant about calculate year on year growth for revenue since all the measures are available in the single column.

jorv86
Oct 29, 2022

To me, 1. Transpose the table 2. Use first row as headers 3. Rename the Measure column as Year 4. Change the data type of the Year column to Date. Yo don't need to unpivot but transpose because you need the measures in columns. Don't you agree?

RichXP
Dec 27, 2022

tried, this one is correct.

safz
Jul 20, 2023

ya i agreed, transpose the table.

Bnxyl
Jul 20, 2023

You cannot change the data type of only a years to date otherwise it will auto generate a DDMMYY format

maymia87
Mar 3, 2024

I agree, I think people disagree because they are not on the same page on the desired outcome table. Since we need a table with the following columns, you just need to transpose: Year Revenue Overheads Cost of goods. Unpivot in useful if the column measure had category values (Countryname, Productname...) not measures. Here we do not want the measures to repeat.

Usm_9
Mar 6, 2024

WAS ON THE EXAM 02 03 2024

Mo2011
May 13, 2024

Transpose Use the first rows as headers Rename the measure as year Change the data type of the year column

DANIEL
Feb 20, 2024

Tested in PBI Desktop with the exact same excel sheet; Transpose : first column values become first row and each row contains its respective values Use first Row as Headers: first row containing values from first excel column, promoting that first row make it a row header : correct. Pay attention to an automatic applied step changing types on the fly too such as: = Table.TransformColumnTypes(#"Promoted Headers1",{{"Measure", Int64.Type}, {"Revenue", type number}, {"Overheads", type number}, {"Cost of Goods", type number}}) Unpivot Other Columns (having measure column selected): creates 3 columns : Measure - Attribute - Value Measure column contains YEAR values only Rename Measure Column to YEAR : because it's the data in it. Now you can filter by attributes and see the evolution year by year

ikramus
Feb 2, 2024

1. Use first row as header 2. Unpivot all columns other than "Measure" 3. Rename "Attribute" to "Year" 4. Change data type of "Year" column to Date Reference: https://docs.microsoft.com/en-us/power-query/unpivot-column

kay1101
Mar 20, 2024

Tested in Power BI, Both unpivot and transpose worked. I think the answer depends on the desired format of outcome table. If you want a 3 * 15 (row * col) table, with each measure and year to be a dependent row, then unpivot. If you want a 5 * 4 (row * col) table, with measures(revenue etc.) are columns and year in the row, then transpose.

0e18c76
Apr 16, 2024

The 3rd step is wrong. You do not need to unpivot. The solution must be: 1. Transpose the table 2. Use first row as headers 3. Rename the Measure column as Year 4. Change the data type of the Year column to Date. This is really a tricky questions and most of us tend to go immediately to "unpivot other columns". The key here is to check the data carefully. And if you noticed on the first column, besides the first row which is measure, the other rows are all fields as well. So transpose instead of unpivot. Please check: https://www.youtube.com/watch?v=0sci44xnto0

greenlever
May 22, 2024

The given answer is correct.

Chellz
Jun 9, 2024

Was on Jun 8, 2024 exam

DANIEL
Feb 28, 2024

answer is right; when you transpose you obtain the correct order requested by the question; year to products 2016-product1; 2016-product2; 2016-product3; and so on when you unpivot, you obtain a different order; product to years 2016-product1; 2017-product1; 2018-product1; and so on

MANANDAVEY
Mar 14, 2024

1. Transpose 2. first row as header 3. Rename the measure coloumn as year 4. Change the datatype 100% TESTED SEQUENCE in PowerBI !!!

rdwn_akml
Mar 28, 2024

TRANSPOSE the table Use first row as header Rename the measure column as Year Change the data type of the year column to Date

SIH007
Apr 29, 2024

Sorry, but the last step is wrong, if you change the year to datatype date you would get 17th July, 1905. Actually my problem is: which 4th option do I select when all remaining options are wrong?????

Bhanu__prakash
May 3, 2024

Please refer this video: https://www.youtube.com/watch?v=0sci44xnto0

SeethaG
Jul 14, 2024

• 1. Transpose the table • 2. Use first row as headers • 3. Rename the Measure column as Year • 4. Change the data type of the Year column to Date.

agelee
Jul 16, 2024

With Transpose there is an issue to do in one step conversion of Year data type from Int to Date (it has to be done in 2 steps int->text->date) and it results in 5 steps, not 4. IDK the answer here.

hayleyxiong33
Jul 18, 2024

The answer is wrong the table should not be transposed