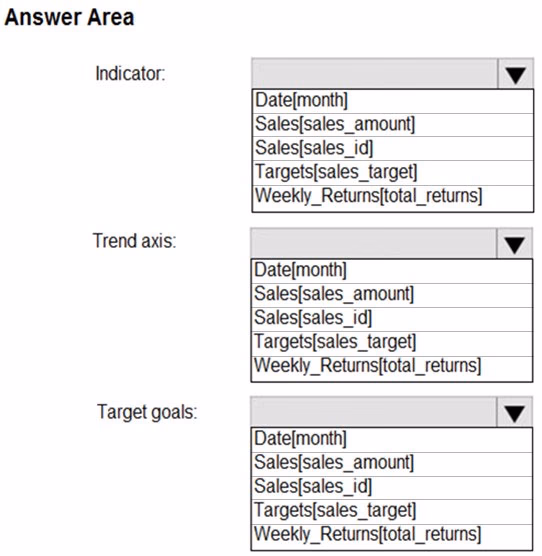
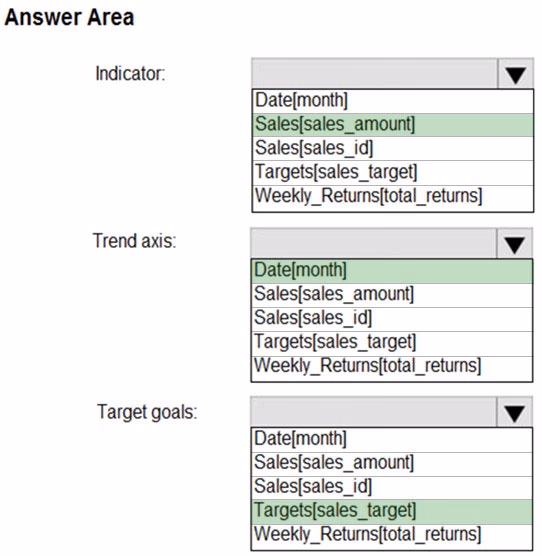
DA-100 Exam QuestionsBrowse all questions from this exam

DA-100 Exam - Question 90


HOTSPOT -

You need to create a KPI visualization to meet the reporting requirements of the sales managers.

How should you create the visualization? To answer, select the appropriate options in the answer area.

NOTE: Each correct selection is worth one point.

Hot Area:

Exam DA-100 Question 90
Show Answer
Correct Answer:
Exam DA-100 Question 90

Scenario: The sales managers require a visual to analyze sales performance versus sales targets.

Box 1: Sales[sales_amount]

Box 2: Date[month]

Time > FiscalMonth. This value will represent the trend.

Box 3: Targets[sales_target]

Reference:

https://docs.microsoft.com/en-us/power-bi/visuals/power-bi-visualization-kpi

Visualize the Data

Discussion

5 comments
Sign in to comment
EllenW
Mar 16, 2021

The answer is correct

mirex
Jun 12, 2021

answer is correct sales amount date (month) target (sales_target)

aguilartu1
Nov 12, 2021

on exam - Nov 11, 2021. my answers: Sales[sales_amount] Date[Month] Targets[Sales_target]

kcwood94
Oct 14, 2021

On exam 10/14/21

Shan
Dec 30, 2021

In exam 30/12/21