Exam PL-100 All QuestionsBrowse all questions from this exam
Question 67

HOTSPOT -

You are creating a capacity planning dashboard with Power BI desktop.

The dashboard must be able to be used within a model-driven manufacturing planning app as well as be embedded within a Microsoft Teams channel.

The data sources are as follows:

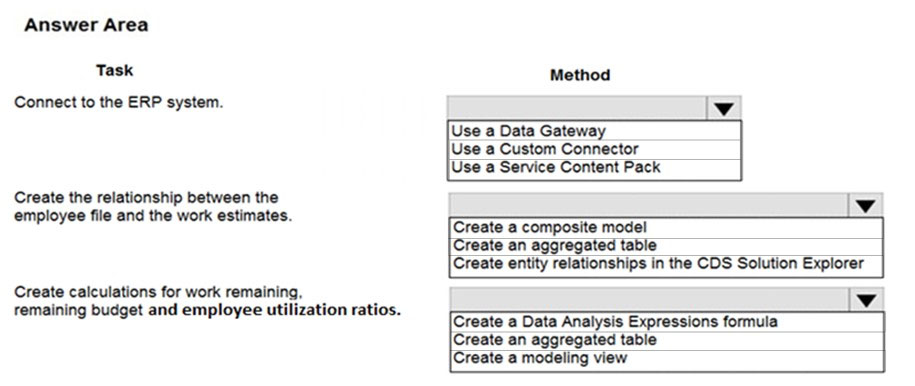
You need to determine the appropriate method for accomplishing each task.

Which methods should you use? To answer, select the appropriate options in the answer area.

NOTE: Each correct selection is worth one point.

Hot Area:

    Correct Answer:

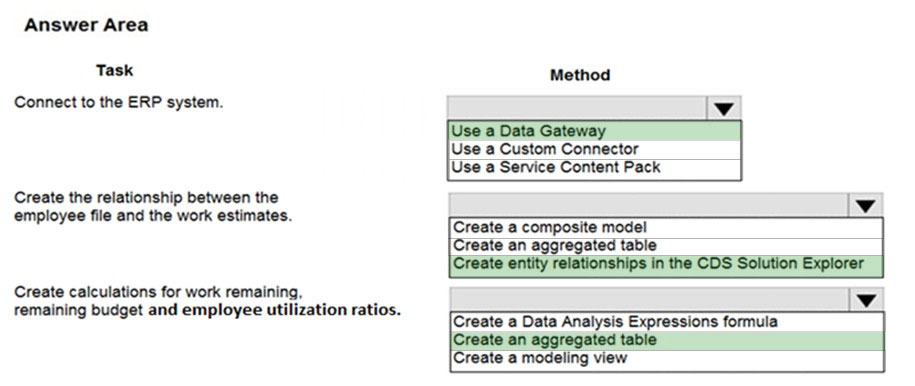
    Box 1: Use a Date Gateway -

    You can install an on-premises data gateway on the same local computer as SQL Server (in production, it would typically be a different computer).

    Box 2: Create an entity relationship in CDS Solution Explorer

    You can create relationships with CDS Solution Explorer.

    Box 3: Create an aggregate table

    Rollup columns help users obtain insights into data by monitoring key business metrics. A rollup column contains an aggregate value computed over the rows related to a specified row. This includes regular tables and activity tables such as emails and appointments.

    Incorrect Answers:

    ✑ Data Analysis Expressions (DAX) is a library of functions and operators that can be combined to build formulas and expressions in Power BI, Analysis

    Services, and Power Pivot in Excel data models.

    ✑ With Modeling view in Power BI Desktop, you can view and work with complex datasets that contain many tables.

    Reference:

    https://docs.microsoft.com/en-us/power-bi/connect-data/service-gateway-sql-tutorial https://docs.microsoft.com/en-us/powerapps/maker/data-platform/create-edit-entity-relationships https://docs.microsoft.com/en-us/powerapps/maker/data-platform/define-rollup-fields

Discussion
bad_atitude

1.GateWay 2.Composite Model 3.Aggregate Table

krishna1234

correct

xkqn2c

It's very frustrating that there is continuous disagreement about what the right answers are. cc: ExamTopics

Domenic

1.Gateway 2.Composite Model - poorly scoped question, could also be done with an aggregated table as no need for direct query. 3.Dax - Aggregated table uses Dax too, ultimately though the data needs to be visualized in the aforementioned dashboard so Measure is best option Also, you can't create a Dashboard with Power BI Desktop

yogithaNP

for 2, isnt Composite model the right choice ?

aduke

Composite model is the right choice.

aduke

https://docs.microsoft.com/en-us/power-bi/transform-model/desktop-composite-models?ns-enrollment-type=Collection&ns-enrollment-id=bookmarks

SashM

This correct

Jajabink

1.GateWay 2.Create relationship in Solution Explorer 3.DAX (Aggregated table is done on one table only)

adegbalajoshua

1. Custom Connector tho

dfretyhg

I'd say 1. Gateway 2. Composite model 3. DAX formula (because we need to actually calculate something not in any of our tables included in the model)

Clubsodas

#3 should be Create a Data Analsys Expression formula (DAX). You'll need to create measures using DAX for what they listed.

LTLE

So Composite for 2?

PBIAANF

We also trust composite model for 2nd

iamchoy

**Task Method** Connect to the ERP system Use a Data Gateway Create the relationship between the employee file and the work estimates Create a relationship in the CDS Solution Explorer Microsoft Docs Create calculations for work remaining, remaining budget, and employee utilization ratios Create a Data Analysis Expressions (DAX) formula Microsoft Docs

Maery

1. Gateway 2. Composite model 3. DAX formula

RoxanaI

the answer is correct