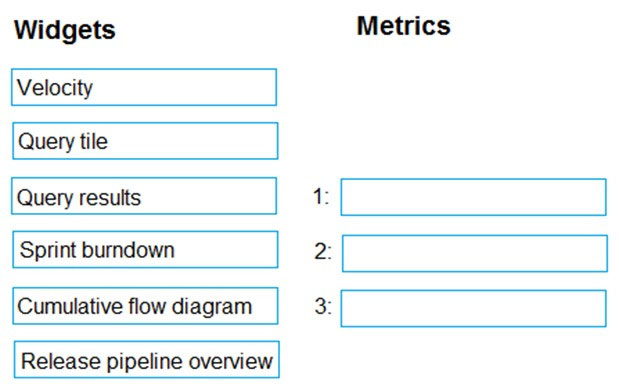
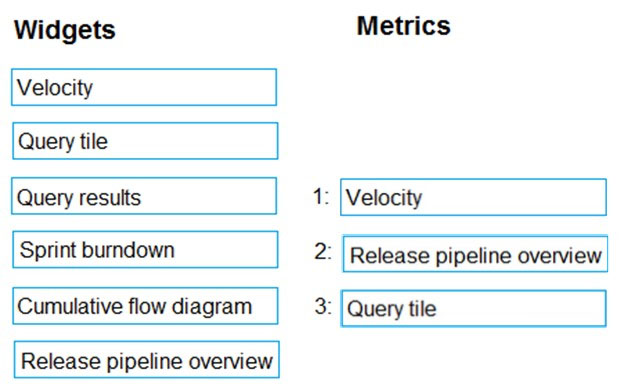
AZ-400 Exam QuestionsBrowse all questions from this exam

AZ-400 Exam - Question 491


DRAG DROP -

You are configuring the Azure DevOps dashboard. The solution must meet the technical requirements.

Which widget should you use for each metric? To answer, drag the appropriate widgets to the correct metrics. Each widget may be used once, more than once, or not at all. You may need to drag the split bar between panes or scroll to view content.

NOTE: Each correct selection is worth one point.

Select and Place:

Show Answer
Correct Answer:

Woodgrove Bank identifies the following technical requirements:

The Azure DevOps dashboard must display the metrics shown in the following table:

Box 1: Velocity -

Velocity displays your team velocity. It shows what your team delivered as compared to plan.

Box 2: Release pipeline overview

Release pipeline overview shows the status of environments in a release definition.

Box 3: Query tile -

Query tile displays the total number of results from a query.

Reference:

https://docs.microsoft.com/en-us/azure/devops/report/dashboards/widget-catalog?view=azure-devops

Discussion

15 comments
Sign in to comment
lglars
Aug 6, 2022

Velocity should be Burndown, velocity is a prediction of what you can finish it's not what has been delivered so far. "Once your team has completed a few sprints, they can use their velocity to forecast how much of the backlog they can finish within upcoming sprints" https://docs.microsoft.com/en-us/azure/devops/report/dashboards/team-velocity?view=azure-devops So: Burndown Release Pipeline Overview Query Tile

pdk88
Sep 10, 2022

Exactly as you say. Velocity is an average based on previous sprints. So if I deliver 10 story points in sprint 1 and 14 story points in sprint 2, I could* have an average velocity of 12 story points. This helps me to estimate a reasonable number of story points in my future sprints. Over time this number will become more accurate. (*This example is simplified, since you will also have work not completed or completed late, which affects velocity). Now a burndown chart on the other hand, shows the remaining story points in a sprint as compared to the story points being delivered in that sprint. It helps the team to see if they are able to finish te remaining work in time. So indeed I would say: Burndown Release Pipeline Overview Query Tile

pdk88
Sep 21, 2022

I have to correct the above, though I stand by my argument. Pamswam (below) has the correct answer and the link proves it. The given answer is right. Velocity Release Pipeline Overview Query Tile

Ranzzzan
Mar 9, 2023

wonder why this high number of votes on partially wrong answer

60ties
Jul 15, 2024

Burndown is the correct answer. Explanations: Generally in scrum development. Velocity is "how fast work is being done". Burndown is a "comparison of completed work versus planned work." Back to the question: On the dashboard [ 'Number 1':'Required Data' ] we have "A comparison between work planned and work delivered". Confirming option-1 answer to be Burndown

xRiot007
Aug 2, 2023

Wrong, velocity is not a prediction, although a lot of PMs use it wrongly that way. Velocity shows you how much work you did in a sprint. You can average multiple velocity values of previous 2,4,6 sprints to obtain an average velocity that can be used as a predictor for the upcoming sprint. Over time this number will become more accurate, if and only the team composition or context of work do not change. In comparison, a burndown chart shows you how much work you have done in the current sprint and how much is left to do. It is used only for the current sprint, not for sprints already delivered.

Inland
Jun 29, 2022

Given answer is correct. https://docs.microsoft.com/en-us/azure/devops/report/dashboards/team-velocity?view=azure-devops

kennynelcon
Jul 27, 2022

I suppose burndown should be accurate not velocity

pamswam
Sep 19, 2022

Velocity (https://learn.microsoft.com/en-us/azure/devops/report/dashboards/widget-catalog?view=azure-devops#velocity-widget) clearly states "shows what your team delivered as compared to plan"

pdk88
Sep 21, 2022

You are right! It's explained the Microsoft way (again). I will correct my answer above.

Pamban
Jun 22, 2023

this question appeared on today's (20/06/23) exam.selected the given answer in examtopics. for the first option I selected Velocity but feel like it should be burndown. however scored 955 :). cheers!

vupham2909
May 5, 2022

Answer is correct.

Jan91
Jun 13, 2022

1. Burndown 2. Release Pipeline Overview 3. Query Tile

akp1000
Jul 27, 2022

Burndown Release Pipeline Overview Query Tile

MohmmadFayez
Aug 30, 2022

velocity is correct read the below link : "Displayed planned work for iterations: Check this box to display the amount of work planned for an iteration at the start of the iteration. This is useful for comparing your planned work to actual deliverables. By default, the count of planned work begins on the start date of the iteration." ------ https://docs.microsoft.com/en-us/azure/devops/report/dashboards/team-velocity?view=azure-devops

giuliohome
Sep 6, 2022

Ok, thank you for the quotation, that is quite convincing indeed.

VladanO
Sep 9, 2022

Velocity -A guide for determining how well the team estimates and meets their planned commitments Query tile - Display total number of results for query Query results - Display results from a query Sprint burndown - report to determine if your team is on track to complete its sprint plan Cumulative flow diagram - to monitor the flow of work through a system Release pipeline overview - use to view and track the status of a release pipeline Answer is correct

LindyLou
Jul 22, 2023

1. Velocity. https://learn.microsoft.com/en-us/azure/devops/report/dashboards/analytics-widgets?view=azure-devops

syu31svc
Sep 6, 2022

Given answer is correct

Atos
Sep 22, 2022

Velocity would not be used for this purpose. It is a planning metric rather than analysis. I agree with lglars

KingTN
Sep 15, 2023

The Velocity shows the Planned vs Completed... The Burndown focus on the remaining work. I vote for: Velocity Release Pipeline Overview Query Tile

ajaykjl
Dec 29, 2022

Burndown Release Pipeline Overview Query Tile Velocity used to compare the previous Sprint . Microsoft definition: The Velocity widget tracks a team's capacity to deliver work sprint after sprint. You configure the widget by selecting a team, a work item type, an aggregation field, and the number of sprints. The widget takes advantage of Analytics data. You can track the velocity for a single team, not multiple teams. https://learn.microsoft.com/en-us/azure/devops/report/dashboards/widget-catalog?view=azure-devops#velocity-widget

xRiot007
Aug 2, 2023

1. Velocity - the previous (delivered) sprint is what we are talking about here. "It allows you to compare the work delivered against your plan and track work that's completed late."

vsvaid
Dec 25, 2023

Velocity Release pipeline overview Query Tile