Exam PL-300 All QuestionsBrowse all questions from this exam
Question 56

HOTSPOT -

You have a column named UnitsInStock as shown in the following exhibit.
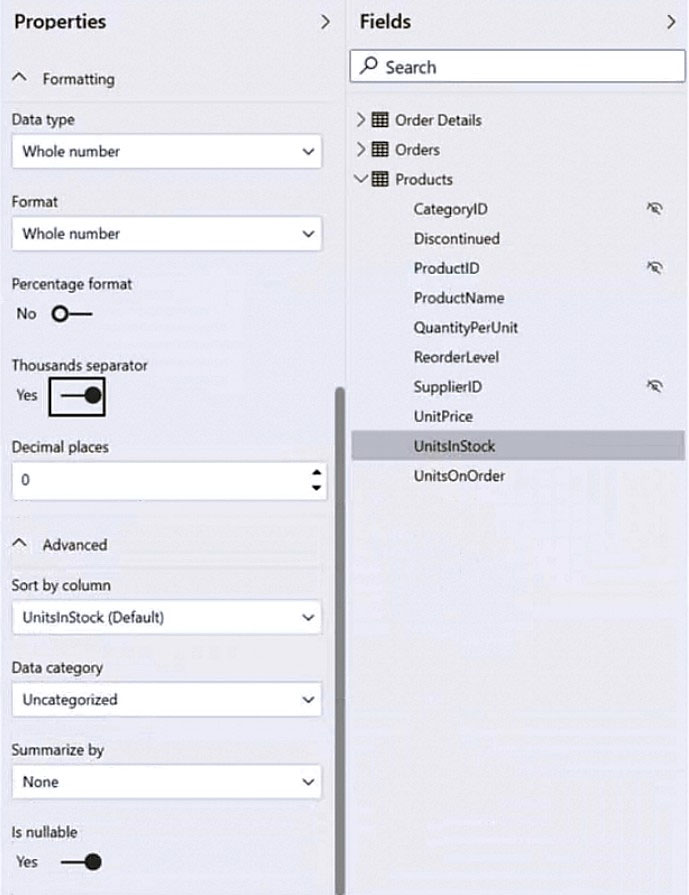
UnitsInStock has 75 non-null values, of which 51 are unique.

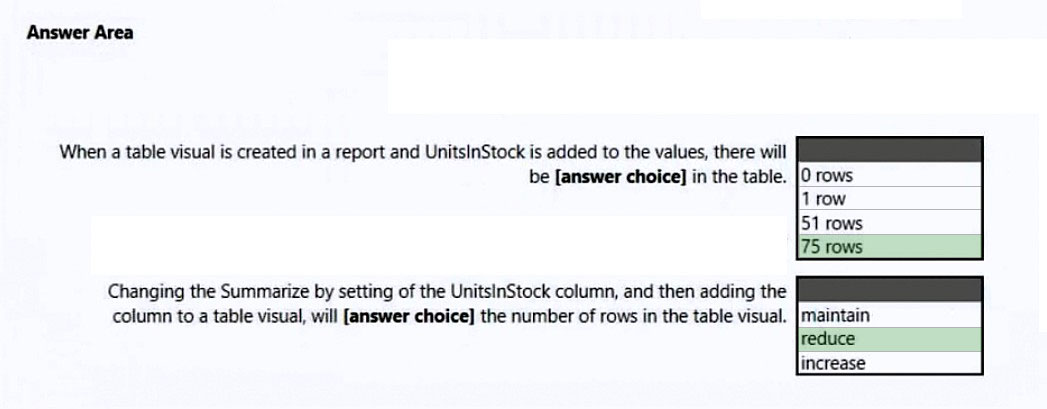
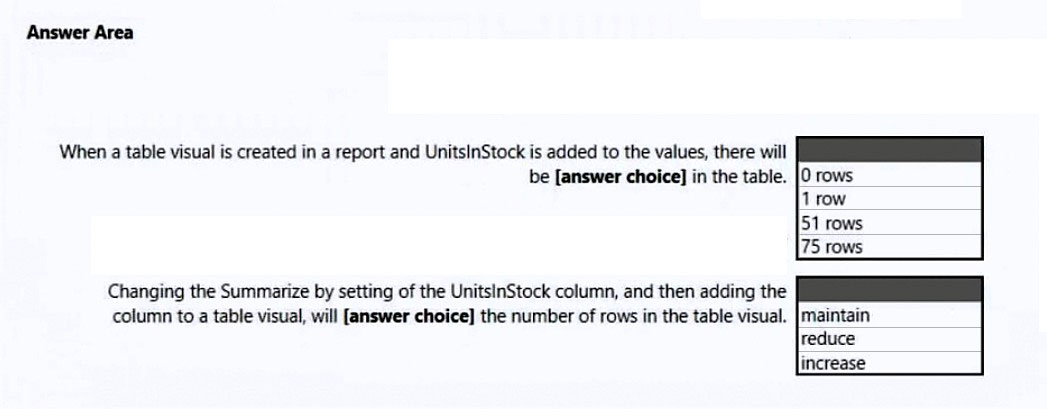
Use the drop-down menus to select the answer choice that completes each statement based on the information presented in the graphic.

NOTE: Each correct selection is worth one point.

Hot Area:
    Correct Answer:

    Box 1: 75 rows -

    Is nullable allows NULL values in the column.

    Box 2: reduce -

    Reference:

    https://blog.crossjoin.co.uk/2019/01/20/is-nullable-column-property-power-bi/

Discussion
Guru1337

If it's the only field in a table only unique values will be shown.

nbn97

only distinct values not unique values so the answer is: 75 rows / reduce

Fer079

Exactly, only distinct values but the question says "UnitsInStock has 75 non-null values, of which 51 are unique", so it does not say 75 distinct values, it says 75 with non-null values, so we can have repeated values. Therefore, I would say 51 / decrease

iccent2

No, it cannot display only the unique. You know what that means? It means if you have a number that is distinct but not unique for example, 5,5,5, then it will not capture it because it is not unique. The answer is 75. Unique means it occurs only once in the column which cannot make up the table rows only. I have actually tried this on PBI with some datatset to confirm. For the second question, when you summarise, it will reduce the table. for example, all products with the same productname will return one row if you drag the productname and unitInstock to the table visual.

margarita98

In that case, if you have 5,5,5, the five will only show once, meaning it will show 51 rows, not 75

cglax

Example: 1,2,3,4,4 contains 5 non-nullable, 4 distinct, 3 unique values. When not summarized and placed in a table, there are 4 rows. The answer to this question should be between 51-75, not one or the other.

Shalaleh

Consider that, this column is in Product dimension table, so all rows are different.

Shalaleh

and also should consider the distribution of values in the column is not important, just the number of rows are important, since we have 75 non-null values, then we will have 75 rows.

Shalaleh

Name of products should be unique. but number of Unitsinstock column does not need to be unique. And since this column is in the Product dimension table, the product names are unique and there are 75 product.

gaikwpa

Correct Answer - Don't Summarize = 75 and After Summarize = 1

Sophieeeeee

If you have tried in PBI, only put that Unitsinstock column in the table, you will know it should be 51.

Time2excel

The answer is correct. 75 rows / reduce. Tested and agreed.

Maniula

It's 51. Table doesn't show duplicated values when there's only one field added. It will show 75 if you set "Summerize by: Count" but Summerize is set to None in the screenshot.

Maniula

Nvm, I forgot that unique in Power BI removes the value from Unique count if the value repeats itself

lmrod

Only distinct values will be shown. Unique isnt't the same that distinct

OGESSIUSER

1 - 1 ROW 2 - increase

ThariCD

The summarization is set to 'Don't summarize' so you will have 1 row per value, not 1 row total. If you add a summarization it will decrease the number of rows.

hmax56

I agree

Namrata_12

SO the Answer is- 1. 75Rows, 2. Reduce, right?

Jahanif

Nice explanation, ThariCD

OGESSIUSER

SO it's 51 Reduce

VeroF

Answer is correct (51 and Reduce). tested

cglax

You did not test. If there are more non-nullable than unique, there will always be more rows than unique. Example: 1,2,3,4,4 has 3 unique, 5 non-nullable, 4 distinct. Placed in a table shows the rows: 1,2,3,4

BiLearn

It will be 1- 75 Rows 2. Reduce (Summarize By - Sum; it will return only 1 row in table visual) I have tested..

Sophieeeeee

Test. It should be 51. And please note that the Unitsinstock column here is not a number, it is text. There is no Sigma sign in front. So there is no SUM summary.

VGG2001

Agreed

VGG2001

Yes, I created a toy excel sheet and tested it. You are correct! The first time we created a table visual, there is only 1 row in the visual and the summarization is set to "SUM". After we changed the summarization to "Dont summarize", the row increased from 1 row to 51 rows.

VGG2001

Sorry for the confusion, I think my answer was wrong. I noticed in the question image the summarization is set to "None", so when you first create the visual, there should be 51 rows. Later change the summarization will change 51 rows to 1 row, so "Reduce"

ReportingPro

This is correct. I tried and tested.

LL_Seva

I passed the exam on 5 April 2024 (906/1000). My answer was: 75 and reduce

Giuditta

this was on exam on 14/03/2024 i scored 948 my answer was 75 rows and reduce

MoneyStacking

For the Guys and Girls, At this page, you will no longer find any free questions from Examtopics. However, if you're hesitant about purchasing Contributor Access, don't hesitate any longer; buy it. It costs only $50 and provides a significant boost to your CV and career. I recently passed with a score of 917 out of 1000. Save yourself time by learning and memorizing all these questions, as 85% of the 50 exam questions were identical to those provided here. Cheers and good luck!

ElieG

So how should we answer in the exam if we face like this question where no answer is correct.

Parth_Mehta

for instance , if we have column : 1,1,2,2,3 so for this, total non null values = 5 , distinct values =3 and unique values = 1 and based on this we do not have any option.. upvote if you agree...

LITSD

The answer is correct. 75 rows / reduce. When added to a table it will show all the non-null values (75). When summarizing by each of those values, then it will only show each discrete value 1 time to show it's frequency of appearance (51 unique characters). 51 < 75 = reduce. Tested and agreed.

Flix

Summarize is set to: None, therefore all values will be shown.

Tinashe16

The question was not well structured, obviously distinct values will be more than 51 (the unique values) since we have 75 non-null values. I happen when you try to theorize practical things.

CookieMingkee

The first question is very tricky. Assuming that the field accept null values and the question says "UnitsInStock has 75 non-null values, of which 51 are unique" should we assume that there is no null value therefor the answer is 75? But what if there is a null value then the answer is 76 that is one (1) null value plus seventy-five (75) non-null values. I tested this with a smaller set of data 14 Distinct (including 1 null value) and 10 unique. With no summarization, my table visual returned 14 rows (representing the distinct value that includes the null value). With summarization, my table visual returned 1 row. Because of that, I will just assume that there are no null values and select 75 for the first question and Decrease to the second question.

Vidushi101

The fact that the values are unique or not is not necessary here. If you are visualising the data for a month and plotting a table with unitstocks for each day, thinking that a record or a row will be removed just because two days in a month had same unitstocks is incorrect. Unless you are summarising(aggregating) records will not be removed on grounds that they do not have a unique value. answer would be 75, reduced.

ElieG

This question makes no sense: it will be 51 values appearing in the visual table for the unique values PLUS the number of distinct values (it could be 1 value or more... so at least we will get 52 values) We have non-null values but if we have null values they will be added also because we are using YES for "is-nullable", so i think the question is not well formed. (try a column from 1 to 51(distinct values) and continue till 75 as u wish and then create a visualization table) and obviously when summarized the rows will be reduced to one.

kay1101

Tried in power bi. when created a table visual with UnitsInStock column(only this column, without ProductID column etc / also without summarization) The number of rows equal the number of distinct values. Since we don't have distinct value here, the answer of first box really depends on how we define [unique]....if unique here = distinct, then 51. if there is ProductID in the table visual then 75.

Fra04

Domanda nell'esame di oggi

arrow040

The UnitsInStock column in PowerBI contains 75 non-null values, out of which 51 are unique1. Therefore, the number of rows in the UnitsInStock column is 75. And, when summarizations are applied the number of rows can only be reduced, since the aggregation process combines multiple rows into a smaller set of summarized values.

iamSophie

1 Row Increase?! when the datatype is Number, by default the summarization is Sum which means 1 row. the second part is tricky, if changing the summarization means removing it, the number increases, if it means changing to count, max, .. the number of rows stay the same means 1 row.