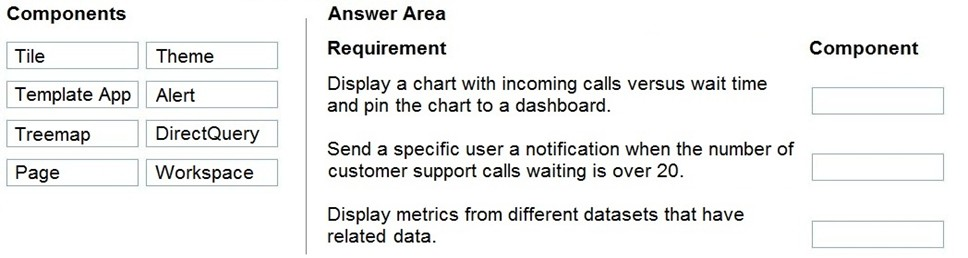
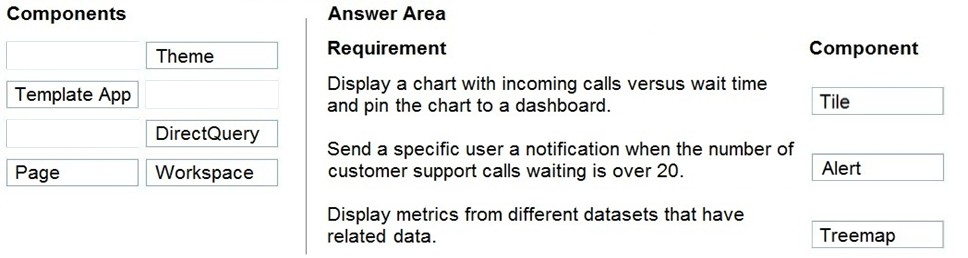
PL-900 Exam QuestionsBrowse all questions from this exam

PL-900 Exam - Question 70


DRAG DROP -

A company plans to display support call metrics on a screen that is visible to all call center staff.

You need to recommend solutions to meet the company's requirements.

What should you recommend? To answer, drag the appropriate components to the correct requirements. Each component may be used once, more than once, or not at all. You may need to drag the split bar between panes or scroll to view content.

NOTE: Each correct selection is worth one point.

Select and Place:

Show Answer
Correct Answer:

Reference:

https://docs.microsoft.com/en-us/power-bi/create-reports/service-dashboard-tiles https://docs.microsoft.com/en-us/power-bi/create-reports/service-set-data-alerts https://docs.microsoft.com/en-us/power-bi/visuals/power-bi-visualization-treemaps

Discussion

17 comments
Sign in to comment
fiorellaps
Apr 8, 2021

For me Tile, Alert and Workspace (you cannot diplay different datasets in the same report)

mohankvs
May 14, 2021

We can display data from different datasets in same report using relationship. I have built this.

JulieBee
Jun 6, 2021

Different datasets or different data sources? Usually a report has 1 or more data sources but only one dataset.

max_n
Jul 12, 2021

@julieBee look @ there https://community.powerbi.com/t5/Desktop/Combine-metrics-from-different-dataset-source-measure-to-show-it/td-p/1496973

AmbitiousLearner
Dec 16, 2021

I don't get why its workspaces. Can some one explain? Why isn't it Pages?

fujifilm
Aug 18, 2022

Because a report page is part of a report. And a report can only be filled by one dataset. That is what I think.

happy777
Jul 9, 2021

Answer is correct Tile, Alert, Treemap Treemap: (From MS learn) Are charts of colored rectangles, with size representing value. They can be hierarchical (RELATED), with rectangles nested within the main rectangles.

happy777
Jul 9, 2021

Ignore the above message. I may be wrong.

hype23
Jul 14, 2024

chatGPT: "No, Treemap would not be appropriate for the requirement "Display metrics from different datasets that have related data." A Treemap is a type of visualization that displays hierarchical data as nested rectangles, and while it can be useful for visualizing data, it doesn't inherently handle the integration of metrics from different datasets. DirectQuery, on the other hand, allows for the integration and real-time querying of data from different datasets, making it the correct choice for this requirement. Therefore, the answer should remain as DirectQuery"

Sisb
Jan 14, 2022

1/Tile https://docs.microsoft.com/en-us/power-bi/create-reports/service-dashboard-pin-tile-from-report 2/ Alert 3/Page

Lee_Tonida
May 13, 2022

Verified. In exam 5/13/2022.

Eltooth
Nov 21, 2022

Tile Alert Workspace

ak1234
Mar 11, 2023

1. Title 2. Alert 3. Directquery

Jieda
Jan 13, 2022

I agree with 3) Workspaces https://community.powerbi.com/t5/Community-Blog/Power-BI-How-to-view-Usage-metrics-in-Power-BI-workspace/ba-p/762580

Aamir009
Jan 29, 2022

For 3 it should be direct query https://docs.microsoft.com/en-us/power-bi/connect-data/desktop-directquery-datasets-azure-analysis-services

ClaraM
Oct 14, 2022

Not sure about that - questions asks nothing about how to connect multiple datasets but how to display related data that is already connected

SHNH
Apr 3, 2023

Tile, Alert & DirectQuery.

Misty39
Apr 22, 2023

Display a chart with incoming calls versus wait time and pin the chart to a dashboard: Tile (once the chart is pinned to a dashboard, it becomes a tile on the dashboard). Send a specific user a notification when the number of customer support calls waiting is over 20: Alert (data-driven alert in Power BI Service). Display metrics from different datasets that have related data: DirectQuery (allows for real-time connections to multiple datasets).

dciferit
Dec 23, 2023

Display metrics from different datasets that have related data. Component: DirectQuery Explanation: DirectQuery allows for the creation of reports and visualizations in Power BI using data that is stored in different datasets. It enables real-time data access and can combine related data from multiple sources. This is useful for displaying metrics that pull from different datasets with related data.

f81043f
May 25, 2024

Exam may 2024:

abe42
May 26, 2024

Tile, Alert and Treemap

hype23
Jul 14, 2024

chatGPT: "No, Treemap would not be appropriate for the requirement "Display metrics from different datasets that have related data." A Treemap is a type of visualization that displays hierarchical data as nested rectangles, and while it can be useful for visualizing data, it doesn't inherently handle the integration of metrics from different datasets. DirectQuery, on the other hand, allows for the integration and real-time querying of data from different datasets, making it the correct choice for this requirement. Therefore, the answer should remain as DirectQuery"

Selma97
Sep 10, 2022

For me, It's TreeMap, Alert, Workspace.

Murtuza
May 29, 2023

Treemap shows related data between the datasets and that is the correct given answer for power BI service

RanaW
Aug 23, 2023

Tile Alert Workspace

hype23
Jul 14, 2024

for C, chatGPT says: DirectQuery allows Power BI to connect directly to data sources and enables real-time updates and integration of metrics from different datasets.

hype23
Jul 14, 2024

and I asked if Treemap would also fit for answer C and "No, Treemap would not be appropriate for the requirement "Display metrics from different datasets that have related data." A Treemap is a type of visualization that displays hierarchical data as nested rectangles, and while it can be useful for visualizing data, it doesn't inherently handle the integration of metrics from different datasets. DirectQuery, on the other hand, allows for the integration and real-time querying of data from different datasets, making it the correct choice for this requirement. Therefore, the answer should remain as DirectQuery"