PL-900 Exam QuestionsBrowse all questions from this exam

PL-900 Exam - Question 62


DRAG DROP -

A company plans to create an information portal that managers can use to view critical information about their teams.

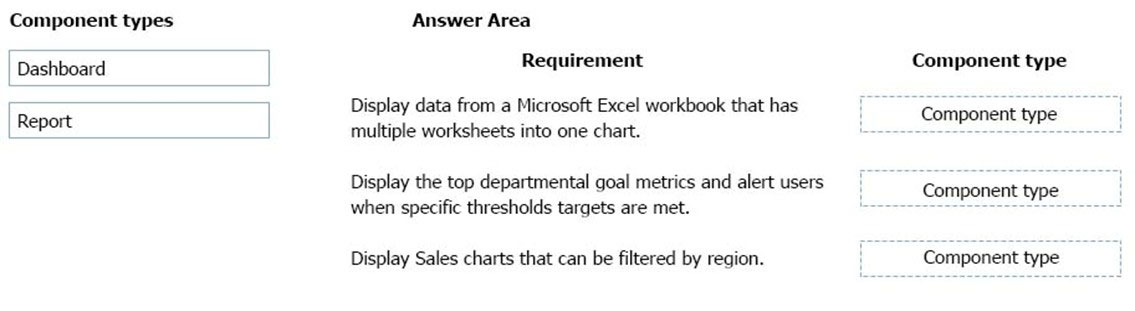
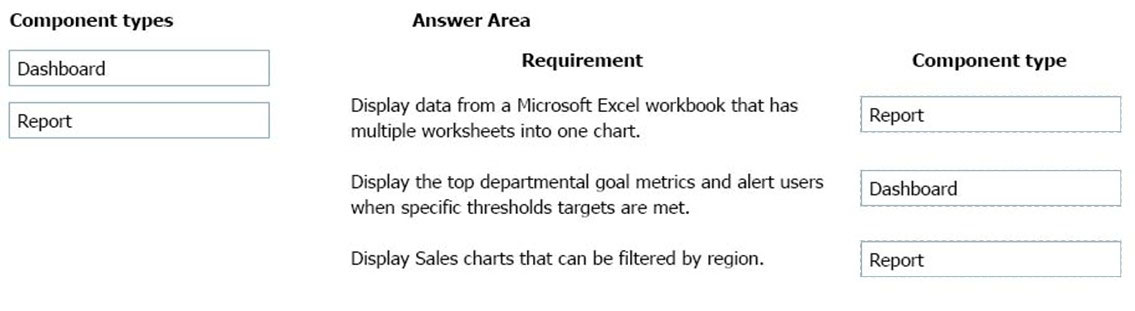
You need to recommend the type of Power BI components that the company should use.

What should you recommend? To answer, drag the appropriate component types to the correct requirements. Each component type may be used once, more than once, or not at all. You may need to drag the split bar between panes or scroll to view content.

NOTE. Each correct selection is worth one point.

Select and Place:

Show Answer
Correct Answer:

Box 1: Report -

Reports are more detailed data displayed in many formats like chart, graphs list and in tabular, etc.

Box 2: Dashboard -

Dashboards are a business key performance indicator view where it displays key values that can change business profits and can be glanced at one screen.

Box 3: Report -

Power BI dashboards cannot slice and dice, but reports have many ways to filter and slice.

Note: Power BI dashboards are one placeholder to display the most important decision-making facts to run a business. But reports are more detailed data displayed in many formats like chart, graphs list and in tabular, etc. Reports are based on one dataset or one business unit data for example reports of a store belonging to California.

Reference:

https://www.educba.com/power-bi-dashboard-vs-report/

Discussion

16 comments
Sign in to comment
Qablan89
Oct 21, 2020

Correct

rituraj14271
Jul 25, 2022

Dashboard (Dashboard 1 page only, Report could be one page or more) , Dashboard(for alerts) , Report (Filtering allowed in reports)

Maniula
Jul 3, 2023

Ad.1 How are you going to combine data from multiple sheets without Power Query?

AZ_Guru_Wannabe
Mar 9, 2023

Report Dashboard (keyword alert) Report (can't filter dashboard) The first one is tricky because, yes, dashboards are a single page view of data (that require an underlying report). So you *could* generate a dashboard from the report of the multiple worksheets chart. However, taking multiple excel worksheets and making a chart is the textbook definition of a report. So the best answer here would be a Report (in my humble and accurate opinion of course).

Rampriya
Dec 7, 2022

In the exam - 06/12/2022 Report Dashboard Report

Elderon
Jun 22, 2022

first statement could also be Dashboards... "Display data from a MS Excel workbook that has multiple worksheets INTO ONE CHART." Their explanation completely ignores that the scenario is talking about a SINGLE chart that is utilizing data from multiple worksheets... the number of worksheets or data sources does not matter, it's the end result of a single chart... which can be a dashboard. I guess I'll still go with their answer but this needs more clarification...

globy118
May 29, 2023

in exam 27/5/2023

Nasrzz
Jun 8, 2023

And the answer was ? Same as it was answered here ?

Kolif
May 13, 2023

Still seen on exam May '23

saadnadir
Mar 14, 2021

answer here : https://docs.microsoft.com/en-us/power-bi/create-reports/service-dashboards

Aunehwet79
Oct 29, 2021

In exam 30th Oct 2021

PraveenGabriel
Nov 13, 2021

Verified - this appeared on 11/13/2021

DevCitizen
Dec 29, 2020

on exam 12/29/20

whatefab
Jan 21, 2021

https://docs.microsoft.com/en-us/power-bi/consumer/end-user-dashboards

prash4pl200
May 29, 2022

Why cant Option C be Dashboards, we can use the slicer functionality?

DNC
Nov 16, 2022

Because we cannot slice and filter in dashboards. See in this link: https://learn.microsoft.com/en-us/power-bi/create-reports/service-dashboards There you will find a table where the functionality of reports and dashboards have been compared. So the last answer ist correct -> report

EwoutBI
Aug 21, 2023

It was already possible in 2016: https://community.fabric.microsoft.com/t5/Service/dashboard-s-slicer/m-p/36002

BitwiseLS
Jun 21, 2022

The answer to the second question has changed with the new Goal functionality

jor_sa
Mar 4, 2022

For first Question it could be a Dashboard? You can create a Chart into the same Excel and then PIN it to a Dashboard. The question says "into a chart"

Snow_28
Mar 17, 2022

It says multiple sheets and report contains multiple pages but dashboard only contains one page so the answer will be report.

hype23
Jul 12, 2024

So, they're after our money...