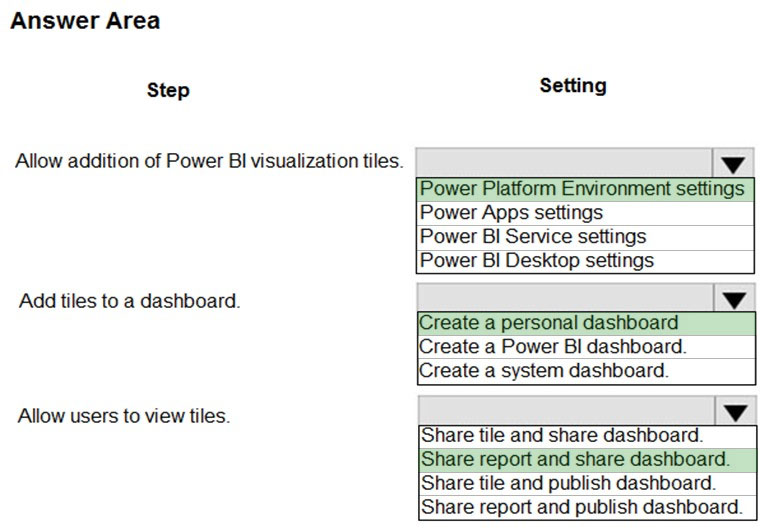
Box 1: Power Platform Environment settings
Before users can embed Power BI visualizations on personal dashboards, the organization-wide setting must be enabled.
1. In the Power Platform admin center, select an environment.
2. Select Settings > Product > Features.
3. Under Embedded content set Power BI visualization embedding to On to enable or Off to disable.
4. Select Save.
Box 2: Create a personal dashboard
You can embed Power BI tiles on your personal dashboard.
1. Open your app and go to Dashboards.
2. Select an existing personal dashboard or select New to create one.
3. On the dashboard, select an area where you want the tile to appear, and then select Power BI Tile on the toolbar.
4. Add new Power BI tile.
5. In the Power BI Tile dialog, select the workspace and then select the Power BI tile that you want to display on your dashboard. Select Enable for mobile if you want to make the tile available for Dynamics 365 for tablets and Dynamics 365 for phones.
6. Select another area of the dashboard and repeat this step to add another Power BI tile, or other component, such as a chart or list, to your dashboard.
7. Select Save to save your dashboard.
Box 3: Share report and share dashboard.
To share your personal dashboard that contains Power BI visualizations you must configure sharing in both Dataverse and Power BI, and the user or group must have the same credentials and appropriate level of access in both services. To share your personal dashboard in your app, go to Dashboards. In the list of dashboards, select the personal dashboard you want, and then select SHARE DASHBOARD.
Reference:
https://docs.microsoft.com/en-us/power-platform/admin/use-power-bi#embed--visualizations-on-personal-dashboards

