Exam AI-900 All QuestionsBrowse all questions from this exam
Question 3

HOTSPOT -

You are developing a model to predict events by using classification.

You have a confusion matrix for the model scored on test data as shown in the following exhibit.
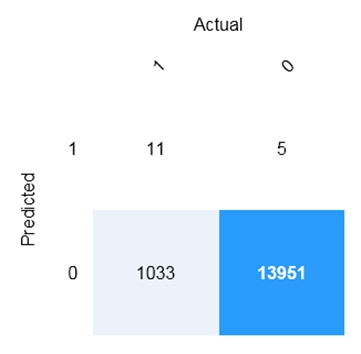
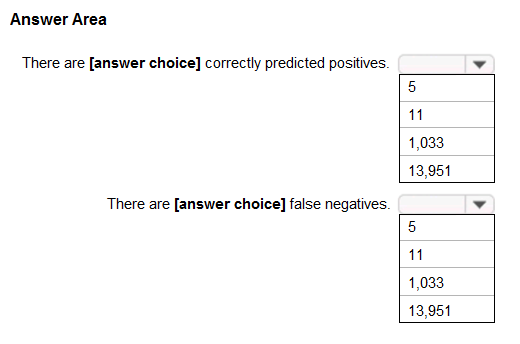
Use the drop-down menus to select the answer choice that completes each statement based on the information presented in the graphic.

NOTE: Each correct selection is worth one point.

Hot Area:
    Correct Answer:

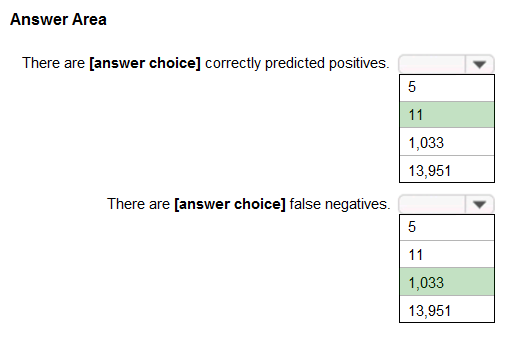
    Box 1: 11 -

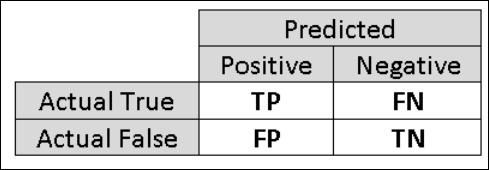
    TP = True Positive.

    The class labels in the training set can take on only two possible values, which we usually refer to as positive or negative. The positive and negative instances that a classifier predicts correctly are called true positives (TP) and true negatives (TN), respectively. Similarly, the incorrectly classified instances are called false positives (FP) and false negatives (FN).

    Box 2: 1,033 -

    FN = False Negative -

    Reference:

    https://docs.microsoft.com/en-us/azure/machine-learning/studio/evaluate-model-performance

Discussion
vijaya

Answer 2 is also correct please refer the https://docs.microsoft.com/en-us/azure/machine-learning/classic/evaluate-model-performance

denizej

Answer 2 is correct. The grid used in the question is reversed to the MS documentation. A false negative would imply that a 0 was predicted but 1 was the actual outcome, of which there were 1033 occurrences according to the grid used in the question.

bhd

Explanation chart shown is wrong Should be TP FP FN TN

zellck

1. 11 2. 1033 https://learn.microsoft.com/en-us/azure/machine-learning/how-to-understand-automated-ml?view=azureml-api-2#confusion-matrix

cgalartxa

Appeared on exam: 04/04/2023.

Jay23AmMonsIV

In Question, Actual is on X-axis and Predicted is on 'Y' axis So answer will be 11 and 1033 TP = 11 TN = 13951 FP = 5 FN = 1033 In Solution, Actual Values are on 'Y-axis' and Predicted Values on 'X-axis' - Thus table get changed.

Tasoh

Hello team, I do not understand this can someone explain why the answer is 11:1033? I do not understand the logic. Thank you

GargoyleFeast

PP = 11 and FN = 1033

BLUE_BUBBLES

The Microsoft table is transposed so use rationale to think through. Answers is correct.

MikeScout

Do not agree with the response for answer 2. If we have a binary classification 'let me say person is 'tall' or 'not tall' (two classes). The confusion matrix shows the top row as row 1 / column 1 which are the true positives (correctly identified as tall). The next value in top row: row 1 and column 0 that is defined as tall (row) and 0 (contains incorrectly classified as 'not tall') and is called false negative. I read the questions that 'false negative' is what they are asking for. table: tall: correctly predicted - not tall predicted not_tall: incorrectly classified as not tall - correctly identified as not tall.

lightecho037

No matter the axis labels (X and Y), the positions of TP, FP, FN, and TN remain consistent within the matrix. Actual Predicted 1 0 1 11 5 0 1033 13951 Interpretation: True Positives (TP): Predicted 1, Actual 1 — Value: 11 False Positives (FP): Predicted 1, Actual 0 — Value: 5 False Negatives (FN): Predicted 0, Actual 1 — Value: 1033 True Negatives (TN): Predicted 0, Actual 0 — Value: 13951

OwlDay

The confusion matrix for the model scored on test data reveals the following: - **True Positives (Correctly Predicted Positives)**: 11 - **False Negatives**: 5 This information is crucial for evaluating the model's performance, especially in a classification task. The true positives represent instances where the model correctly predicted the positive class, while false negatives indicate instances where the model failed to predict the positive class when it should have. Understanding these metrics helps assess the model's accuracy and effectiveness in identifying positive cases. Source: Conversation with Copilot, 27/6/2024

Idontcareanymore

I had a lot of difficulties with the answer for this question. However, now that I have been able to step back and look at the chart objectively, you realize that it is not a chart for determining, it a representational chart, where you are being presented the results. That is why the response is actually correct.

Vanessa23

11 corresponds to 0-0 1033 corresponds to 0-1

Rahulkhd

I have found some answer are wrong and explanation is not proper. You can use this course for proper explanation and correct answers https://www.udemy.com/course/microsoft-azure-ai-900-latest-practice-test-2023/?referralCode=25EA856C8C63BC4DE950

rdemontis

given answers are correct

rdemontis

answers and explanations are correct