IASSC Certified Lean Six Sigma Black Belt

Here you have the best Six Sigma ICBB practice exam questions

  • You have 99 total questions to study from
  • Each page has 5 questions, making a total of 20 pages
  • You can navigate through the pages using the buttons at the bottom
  • This questions were last updated on November 20, 2024
Question 1 of 99

The Control Limits width varies if the sample size varies for which type of chart?

    Correct Answer: A

    The control limits in a P-chart, which is used for plotting the proportion of defectives, vary with changes in sample size. Because the control limits are calculated using the sample size (n), differing sample sizes from one subgroup to another will result in different control limits.

Question 2 of 99

Which of these elements are not included in Implementation plans?

    Correct Answer: C

    Cost/Benefit ratios are typically included in the business case or project charter rather than in implementation plans. Implementation plans more commonly include a work breakdown structure, risk management plans, and planned audits of work completion.

Question 3 of 99

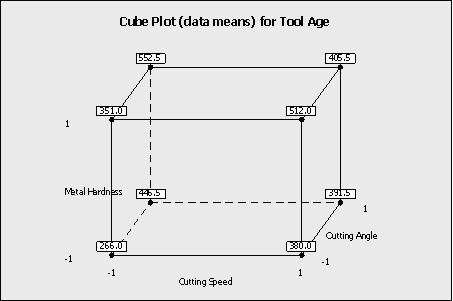
Which statement(s) are correct about the Factorial Plot shown here? (Note: There are 3 correct answers).

    Correct Answer: A, B, C

    When the cutting speed increased from low to high level, the tool age increases. This can be observed from the plot where the tool age values at higher cutting speeds are higher compared to the lower cutting speeds. The coefficient of the metal hardness is positively related to the output of tool age, which is evident as the metal hardness values increase, the tool age also increases. The coded coefficient is lower for cutting speed than the cutting angle related to the output of tool age, which can be understood by comparing the slopes or differences in means between changing levels of cutting speed and cutting angle.

Question 4 of 99

If an experiment has 5 factors and no replicates for a 2-level Experimental Design with 16 experimental runs which statement is incorrect?

    Correct Answer: D

    In a 2-level factorial design with 5 factors, the total number of possible combinations is 2^5 = 32. If the design is using 16 experimental runs, it indicates a half-fractional factorial design. Therefore, Statement A is correct. Main effects in half-fractional designs are typically confounded with higher-order interactions depending on the design, so Statement B and C can be correct under such circumstances. However, Statement D is incorrect because, in a half-fractional design, each level of a factor should appear equally often across runs. Hence, it is impossible for 8 experimental runs to have the first factor consistently at the high level without skewing the design balance.

Question 5 of 99

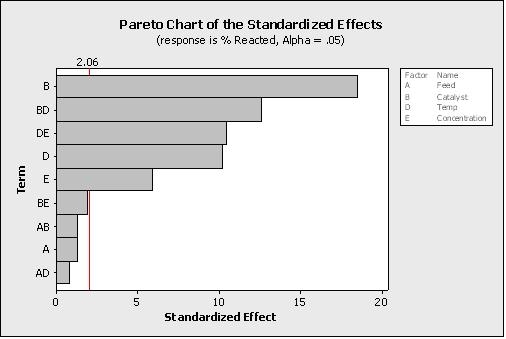
Which statement(s) are correct about the Pareto Chart shown here for the DOE analysis? (Note: There are 2 correct answers).

    Correct Answer: A, C

    The Pareto Chart of the Standardized Effects is used to identify and prioritize the factors that have significant effects in a Design of Experiments (DOE) analysis. From the chart, we can determine that the effects of B, BD, DE, D, and E are significant as their bars cross the vertical line indicating the threshold for significance (standardized effect greater than 2.06, which relates to an alpha risk of 0.05). Therefore, the correct statements are that it is unknown from this graph how many factors were in the experimental design, and the effects to keep in the mathematical model are E, D, DE, BD, and B with an alpha risk equal to 0.05.